
FIGURE 17.25 Average July global precipitation over North America and adjacent ocean regions for the period 1951-2000. The dataset used is NOAA 20th Century Reanalysis Version 2. Image Source: Climate Reanalyzer (https://climatereanalyzer.org), Climate Change Institute, University of Maine, USA.
Figure 17.23 describes the average annual precipitation for the North American continent and adjacent ocean regions over fifty years (1951-2000) measured in millimeters per year. Three areas of high precipitation are evident on this map of North America. Along the west coast, higher precipitation occurs from Alaska's Aleutian Islands south to Oregon. This band of precipitation extends inland between 500 and 1000 kilometers and generally decreases in intensity with increasing distance from the Pacific Ocean. This area of higher precipitation results from two climate factors: eastward-moving mid-latitude cyclones originating in the Pacific Ocean and localized orographic uplift caused by the presence of mountains along the west coast of North America. The second region of high precipitation covers the eastern half of the United States and the eastern third of Canada. Factors responsible for this precipitation include thunderstorms, mid-latitude cyclones, and hurricanes. The final region of high precipitation is located in the southern half of Mexico. Precipitation that falls here is mainly caused by the summer northward migration of thunderstorms associated with the Intertropical Convergence Zone (ITCZ).
We can also observe in Figure 17.23 two regions of relatively low precipitation. One region exists from central Canada northward up to the Arctic. Precipitation is low in this region because of its distance from a moisture source and because this area is often under the influence of relatively cold, dry Continental Polar and Continental Arctic air masses. The second region of low precipitation is found in the southwestern United States and northern Mexico. A large and intense subtropical high pressure system frequently influences this part of North America. The descending air associated with such weather systems inhibits the lifting parcels of air required for air mass cooling and precipitation formation.
Figure 17.24 describes North America's average January pattern of precipitation based on fifty years of data (1951-2000). The colder temperatures and low humidity common in the winter season keep the central part of North America relatively dry. More precipitation occurs from Alaska's Aleutian Islands southward to Oregon on the west coast. The high levels of precipitation found here are caused by the frequent occurrence of mid-latitude cyclones originating in the Pacific Ocean. Mid-latitude cyclones are also mainly responsible for the band of higher precipitation found along the east coast of North America. The primary source of moisture for these cyclonic storms is the Gulf of Mexico and the Atlantic Ocean.
The average July precipitation pattern for North America based on 50 years of data (1951-2000) is shown in Figure 17.25. In summer, the Gulf of Mexico is a source region for moist air masses traveling into the central United States and eastern North America. This moist air fuels the formation of many thunderstorms, often associated with mid-latitude cyclones that travel from Alaska to the southeastern United States and then northward to eastern Canada.
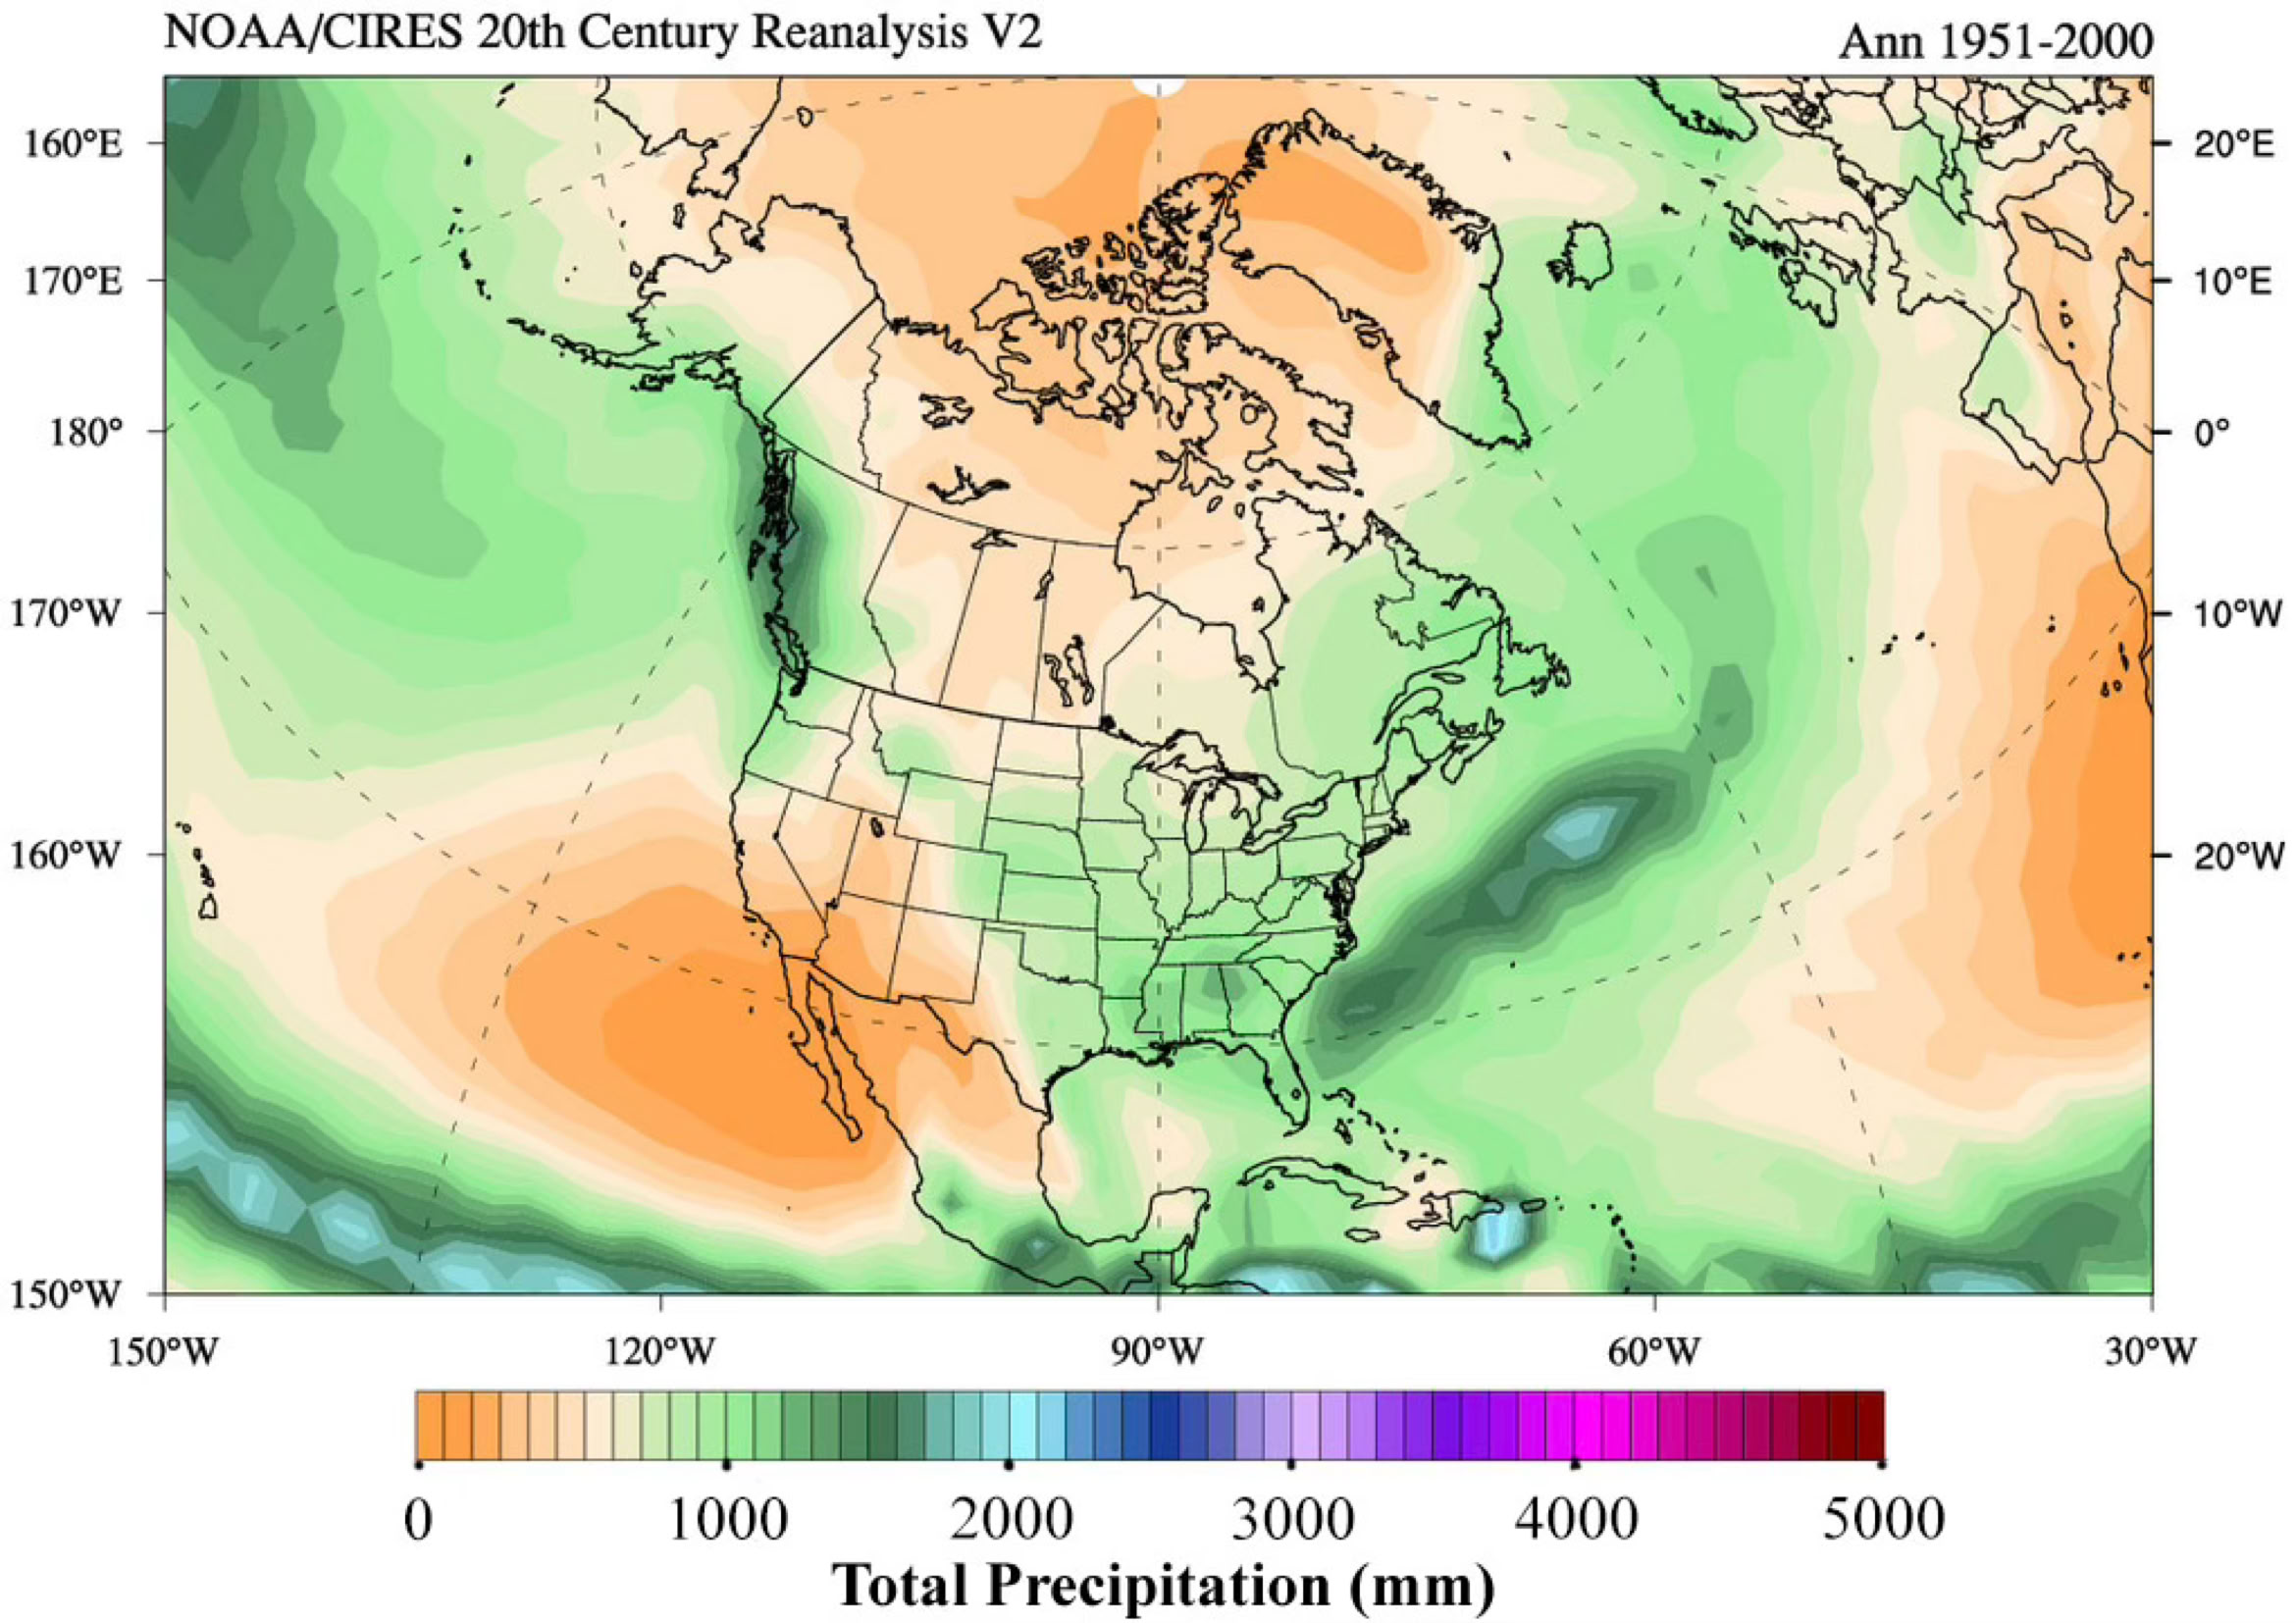

FIGURE 17.24 Average January global precipitation over North America and adjacent ocean regions for the period 1951-2000. The dataset used is NOAA 20th Century Reanalysis Version 2. Image Source: Climate Reanalyzer (https://climatereanalyzer.org), Climate Change Institute, University of Maine, USA.
FIGURE 17.23 Average annual global precipitation over North America and adjacent ocean regions for the period 1951-2000. The dataset used is NOAA 20th Century Reanalysis Version 2. Image Source: Climate Reanalyzer (https://climatereanalyzer.org), Climate Change Institute, University of Maine, USA.