FIGURE 6.7 Calculation of daily mean surface air temperature. Daily mean surface air temperature is a measure derived by taking the average of the sum of the daily minimum and maximum temperature. Image Copyright: Michael Pidwirny.
Instruments for Measuring Temperature
Any instrument used to measure a substance's temperature is called a thermometer. The most common type is the liquid-in-glass thermometer. Liquid-in-glass thermometers consist of a sealed glass tube with a small, uniform bore and a bulb at one end, partially filled with a suitable liquid. The liquid used in these devices physically responds to the addition or loss of heat energy from the outside environment by changing its volume. When heat is added, the liquid inside the bulb expands and moves up the thermometer's tube. Cooling causes the liquid to contract. The length of a liquid-in-glass thermometer's tube is graduated with quantities calibrated to values on standard temperature scales. The two most common temperature scales used worldwide are Celsius and Fahrenheit (Figure 6.2). By international agreement, most countries use the Celsius scale for meteorological measurements. The United States is the only major country still using the Fahrenheit scale.
The measurement of daily fluctuations in surface air temperature typically uses two types of liquid-in-glass thermometers (Figure 6.3). To record the lowest daily temperature, a minimum thermometer is used. Minimum thermometers are filled with red-dyed alcohol to make the liquid more visible. Alcohol is appropriate for measuring the daily minimum temperature because of its low freezing point (-112°C or -170°F). Temperature readings are made from a minimum thermometer by noting the position of the black index slider in the instrument's tube (Figure 6.4). The index slider can freely move up and down the part of the tube that is filled with alcohol. The thermometer is mounted horizontally to stop gravity from transporting the index slider to the bottom of the tube. In this position, the slider can only be moved by surface tension at the point where the top of the alcohol column meets the void in the tube. The index slider is pushed down the thermometer tube as the alcohol contracts, recording the lowest temperature achieved. When the temperature rises, the expanding alcohol does not influence the slider's position. The thermometer is reset by tilting the bulb upward, which positions the index slider just below the top surface of the alcohol column again.
The other type of thermometer used to record daily temperature fluctuations is called the maximum thermometer. This liquid-in-glass instrument records the highest temperature for a set period. Maximum thermometers differ from minimum thermometers in that they are filled with mercury. Mercury thermometers are not used to measure low temperatures because mercury freezes at -39°C or -38°F. The construction of the maximum thermometer is quite similar to that of medical thermometers used to measure human body temperature. At the bottom of the thermometer is a reservoir bulb connected to a tube that extends up the instrument's shaft. Between the bulb and the tube is a very narrow constriction that regulates the flow of mercury from the bulb into the tube. As the temperature increases, the constriction allows the mercury column to rise in the tube due to thermal expansion. However, the constriction is too narrow to allow the mercury in the tube to flow back into the bulb during cooling. As a result, the maximum temperature is recorded. Shaking the thermometer vigorously resets it, as this motion forces the mercury in the tube past the constriction and back into the reservoir bulb.
Instrument Shelters
By international agreement, the world's nations have decided to measure surface air temperature in a similar way. This standardization is important for accurately generating and comparing weather maps and forecasts, both of which depend on uniformly defined data. This standardization requires that surface air temperature measurements be recorded in the shade of an instrument shelter. This requirement ensures that we measure only the temperature of the heat energy in the air around the thermometer. A thermometer exposed to direct sunlight will gain additional heat from absorbed solar radiation, resulting in false readings.
The World Meteorological Organization (WMO) recommends using a specific type of instrument shelter, known as a Stevenson Screen, to house maximum and minimum thermometers (Figure 6.5). The basic design of the Stevenson Screen consists of a wooden box with a hinged door opening at the front. The box's exterior is painted white to minimize solar radiation absorption. The box is also mounted on a steel or wood stand, elevating it to about 1.5 m or 4.9 ft (varies from country to country between 1.2 and 1.8 m or 3.9 and 5.9 ft). Ventilation is made available to the box's interior through openings in the double roof, the box bottom, and the louvered sides. This ventilation ensures that the thermometers mounted inside the box always receive a fresh air supply. Some Stevenson Screens have a fan connected to the box that supplements ventilation during periods of still air or low winds. Finally, the WMO recommends that Stevenson Screens be located on a grassed surface to maintain consistency in measurement.
Some weather stations also continuously take temperature readings. To obtain continuous readings, a special type of instrumentation is required. This type of instrumentation is sometimes called a Maximum Minimum Temperature System or MMTS (Figure 6.6). The instrument housing of an MMTS is much smaller than a Stevenson Screen and resembles a vented beehive. Inside this instrument shelter is a mountedthermistor(thermal resistor) for measuring temperature. A thermistor is a type of thermometer that measures temperature electronically.
Temperature Means, Ranges, Normals, and Extremes
Surface air temperature measurements are normally expressed relative to a period or an instant in time. Generally, the shortest time in which surface air temperature is expressed is one day or 24 hours (midnight to just before midnight on the next day). As previously stated, we record the maximum and minimum temperatures for each day of the year at over 15,000 weather stations. By dividing the sum of the daily maximum and daily minimum temperature values at a station by two, we can calculate a quantity known as the daily mean temperature (Figure 6.7). The daily temperature range is computed by determining the difference between the daily maximum and minimum. The monthly mean temperature is found by summing all the daily means for a particular month and dividing this sum by the number of days in that month. The annual mean temperature is calculated by averaging all twelve monthly mean values in a particular year of interest. To determine the annual temperature range, we would find the difference between the warmest and coldest monthly mean temperatures.
Temperatures vary with time. These variations can occur annually, daily, or even hourly. The magnitude of these variations can only be evaluated by looking at records of past measurements for similar periods or occasions. Scientists often analyze these data sets to determine meteorological normals and extremes. A meteorological normal is computed by finding the average of a measured meteorological element, like surface air temperature, over many years. A meteorological extreme is a meteorological element's highest or lowest value in a specified period. Data covering a continuous period of at least 30 years is usually needed to compute these values. Figure 6.8 describes the meteorological normals and extremes for the monthly mean temperature data for Kelowna, British Columbia, Canada, based on 88 years of record. Normals and extremes provide a useful yardstick to assess the relative significance of new observations. For example, is the new measurement similar to the normal, closer to the extreme values, or has it set a new extreme benchmark? Normals and extremes can also be used in planning future activities that rely on specific temperature regimes.
Table 6.1 lists high and low-temperature extremes for various regions of the world. Because of the variable nature of the Earth's climate system, we can never be quite sure when these records will be broken in the future. Without a doubt, some of these records will fall in our lifetime! It is also important to note that, for most places, our records of past temperature fluctuations are less than 100 years long.

FIGURE 6.2 Fahrenheit and Celsius temperature scales. The Celsius (°C) and Fahrenheit (°F) scales are the most common systems used to measure temperature. Image Copyright: Michael Pidwirny.

FIGURE 6.3 Standard minimum (top) and maximum (bottom) thermometers used to measure surface air temperature. Image Copyright: Michael Pidwirny.

FIGURE 6.4 The minimum thermometer measures the lowest temperature over a specific period with a metal slider inside the thermometer's bore. The surface tension at the top of the alcohol column moves the slider as the temperature drops. When the temperature increases, the slider does not move with the expanding alcohol. In this example, the recorded minimum temperature is 15°C. Note that the current temperature is about 22.5°C. Image Copyright: Michael Pidwirny.

FIGURE 6.5 Stevenson Screen meteorological instrument shelters. These shelters are typically made of wood, painted white, and have louvered sides. They are also elevated to about 1.5 meters (about 4.5 feet) on a wooden or metal base. Some instrument shelters have an electric fan attached to improve air circulation in the instrument box during light wind conditions. Image Copyright: Michael Pidwirny.

FIGURE 6.6 The following meteorological instrument is called a Maximum and Minimum Temperature System (MMTS). These systems have three parts: a white-ventilated instrument shelter, an internal electrical thermistor, and a computerized data storage device (data logger). Thermistors are a type of thermometer that measures temperature because the electrical resistance of a conductor varies with temperature. Thermistors can provide a continuous digital record of temperature change. From this record, maximum, minimum, and mean temperatures can be determined daily. The National Weather Service is replacing the older liquid-in-glass thermometers with the digital Maximum and Minimum Temperature Systems at many of their primary and cooperative observing stations across the United States of America. Image Copyright: Michael Pidwirny.

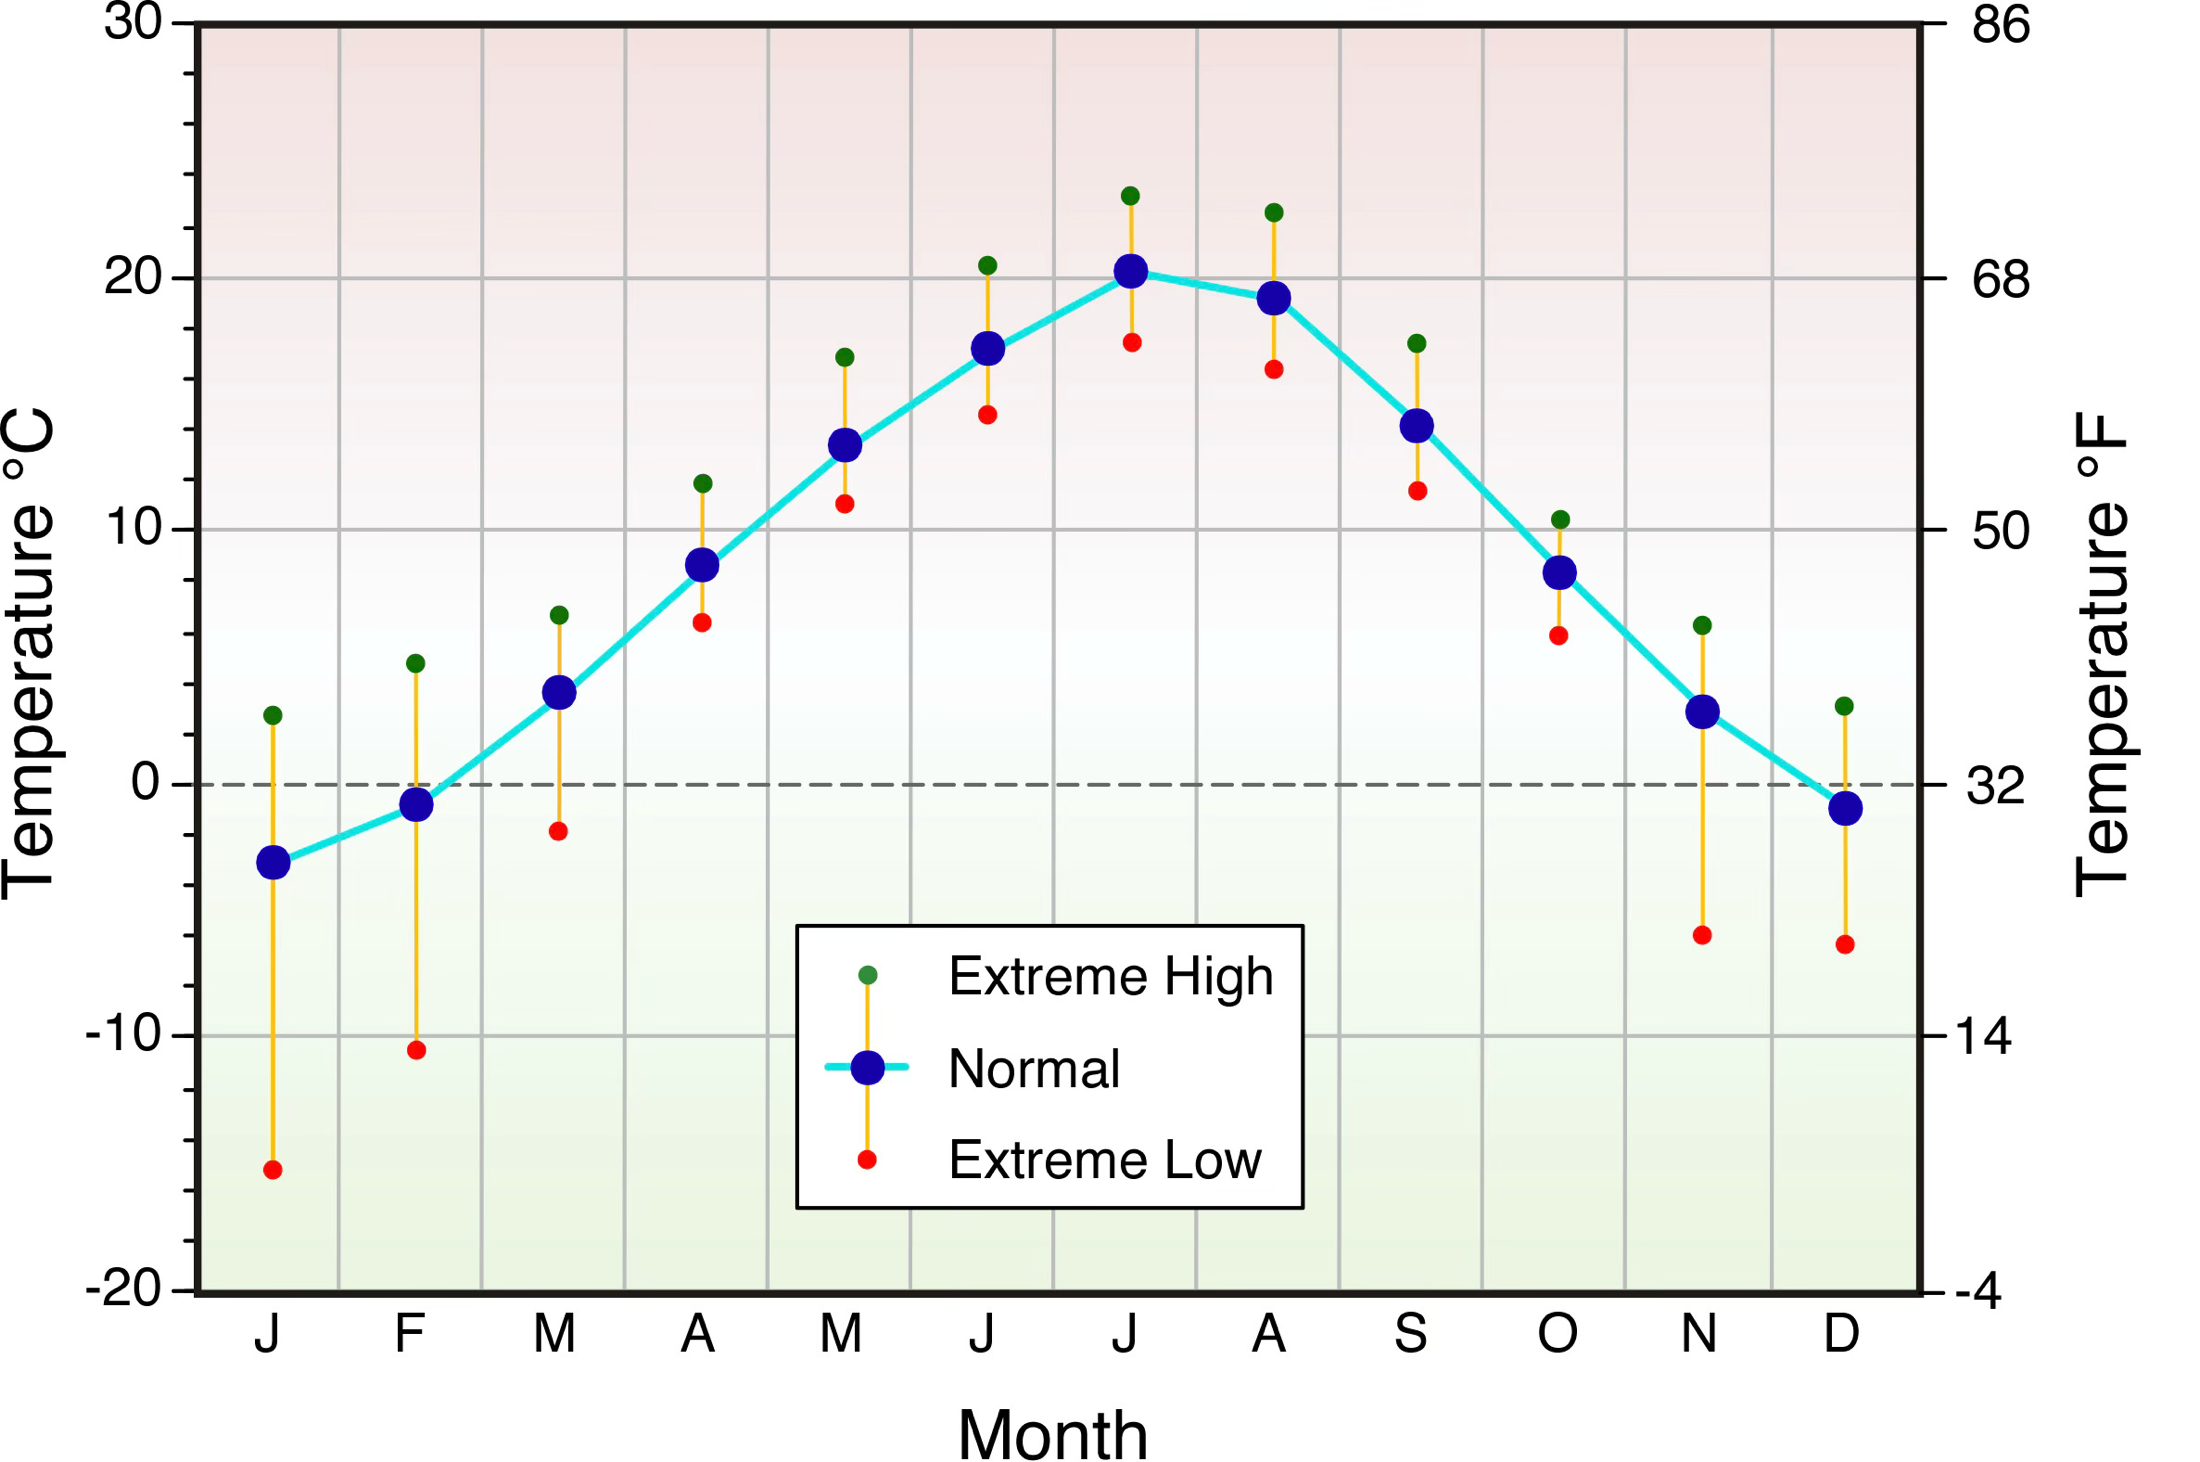
FIGURE 6.8 Mean monthly temperature normals and extremes for Kelowna, British Columbia, Canada for the period 1903 to 1991. Image Copyright: Michael Pidwirny.
