Types of Biodiversity
We often ignore the importance of the plants and animals around us. Humans have used these living resources as a source of food, clothing, transportation, labor, and substances for industrial products and medicines. The types of species we currently use to better our lives represent only a tiny proportion of the total number of species now living on this planet.
Biologists estimate that about 5 to 100 million different species inhabit the Earth. Of these species, approximately 1.4 million have been classified, including more than 250,000 plants, roughly 45,000 vertebrates (animals with backbones), and close to 750,000 species of insects (Figure 11.33). Most of the unclassified species on our planet are invertebrates or animals without backbones. This group of organisms includes insects, spiders, mollusks, sponges, flatworms, starfish, urchins, earthworms, and crustaceans. Most of these undiscovered species probably live in the tropical rainforests. The cataloging of species in the tropical rainforest has been relatively limited so far. Scientists estimate that this single biome may contain 50 to 90% of the Earth's living diversity.
Assessing the number of different organisms living on this planet is difficult. Foremost, we lack a precise definition of what exactly defines a species. The concept of a species often refers to a population of physically similar individuals that can successfully mate with each other but cannot produce fertile offspring with other organisms. However, many species comprise several distinct populations that can interbreed despite physiological and anatomical differences. The diversity of life also manifests itself at the ecosystem level. Any particular patch of habitat within any major ecosystem type consists of unique combinations of species populations and associated abiotic conditions and processes. As a result, each patch of habitat can be considered unique in some way.
Scientists have developed the concept of biodiversity to overcome the difficulties described above. Biodiversity describes the diversity of life at the following three biological levels:
Genetic Diversity – refers to the total number of genetic characteristics expressed and recessive in all the individuals that comprise a particular species.
Species Diversity – the number of different species of living things living in an area. As mentioned above, a species is a group of similar plants or animals that can breed and produce viable offspring under natural conditions.
Ecosystem Diversity – the variation of habitats, community types, and abiotic environments present in a given area. An ecosystem consists of all living and nonliving things in a given area that interact with one another.
Global Patterns of Species Diversity
Geographical patterns of species diversity can be examined at various spatial scales. At the global scale, there is a general gradient of decreasing species diversity as one travels from the equator to the poles (Figure 11.34). This trend is observed for many organisms, even those living in freshwater and marine environments. Further, this gradient is seen throughout geological time as far back as one can find enough fossil data. Researchers have shown that a latitudinal gradient of land plant diversity has existed for at least 110 million years. There are only a few known exceptions to this spatial pattern. For example, penguins and seals tend to reach their greatest diversity at high latitudes, while coniferous tree species are most diverse in temperate latitudes.
Understanding the factors responsible for global-scale latitudinal gradients in species diversity is an essential area of study in biogeography. As such, more than 25 theories have been put forward to explain this relationship (Table 11.3). Some of these theories are not mutually exclusive. Many of the theories suggested mechanisms that could be working together in some fashion.
We can continue this discussion by reviewing some of the more popular explanations for the global species diversity gradient. Several theories suggest that an underlying abiotic characteristic of Earth controls global patterns of species diversity. One theory, in particular, indicates that spatial differences in the amount of solar energy available for plant photosynthesis cause the gradient. As we discovered in Chapter 4, the annual amount of solar radiation received at ground level increases from the poles to the equator. With more photosynthesis is greater biomass production. More biomass would, of course, support the feeding needs of a larger number of species. Biomass is also often used by species for shelter, nesting, and other non-feeding activities.
Others have pointed out that global patterns of species diversity may be related to several different climatic factors. Temperature variability increases from the equator to the high latitudes. In unvarying climates, species are subject to less environmental stress and disturbance. Frequent disturbances would lead to a lower speciation success rate, as severe environmental conditions would cause death and possible species extinction at the local to regional scale. Glaciers have also regularly invaded high and middle latitude regions during the Pleistocene. Each glacial advance wipes the ground surface free of species, and the efforts of evolution are lost. Reestablishing organisms and subsequent speciation during warm interglacials is a gradual process that can continue until the climate cools again.
Another vital factor that varies with latitude is surface area. The theory of island biogeography suggests that larger areas can support more species than smaller areas (Figure 11.35). The reason for this statement is very straightforward. More space means more potential sources of food and homes for organisms. Because the Earth is a sphere, the surface area is at a maximum around the equator and declines to almost zero at 90° North and South. But this particular surface-area relationship depends on the fact that we are using lines of latitude as the standard for measurement. Measuring surface area using lines that are perpendicular to the lines of latitude would, of course, produce different results. However, let's treat surface area (measured along lines of latitude) as a secondary effect and combine it with solar radiation or temperature gradients. We can generate a plausible explanation. In this explanation, solar radiation and temperature gradients cause various life forms to naturally zone themselves according to latitude.
Other Species Diversity Patterns
Interesting spatial patterns of species diversity also exist at smaller scales. This fact is clearly apparent even at the continental scale, as shown in Figures 11.36 and 11.37. Mammals and land birds both exhibit a general latitudinal diversity gradient. However, within this pattern, there are obvious anomalies. For both life-form types, diversity tends to be greater on the western side of North America. Mountainous landscapes dominate Western North America. Biogeographers believe that the presence of mountains enhances species diversity by increasing habitat variation. Eastern North America, where species diversity is lower, consists mainly of relatively flat plains that show considerably less habitat variation.
Another interesting pattern occurs on peninsulas. Peninsulas tend to have less species diversity than adjacent continental areas at the same latitude. On peninsulas, species diversity also tends to drop further as you move away from their continental connection. These patterns are clearly evident in both mammals and land birds on the peninsulas of Baja California and Florida (Figures 11.36 and 11.37). The reason for the peninsula pattern has been vigorously debated among biogeographers. Some believe historical factors could be responsible. For example, over the last few million years, higher sea levels have occurred. Higher sea levels would submerge much of Florida. Most of this state is relatively flat and has an elevation close to sea level. Flooding would vastly reduce the amount of habitat available for terrestrial organisms. It would have also caused the localized extinction of the various species that lived in Florida before the flooding. Re-colonization of these species from the North American continent would occur when sea levels dropped, exposing submerged land once more. This re-colonization would take considerable time and would be influenced by the distance to the mainland connection (Figure 11.38).
The flooding hypothesis cannot explain the low species diversity observed on the Baja Peninsula. This region of North America is generally elevated well above sea level and, therefore, was never submerged. The Baja Peninsula does have an extremely hot, arid climate. Low water availability and high temperatures may explain why species diversity declines on this peninsula relative to the neighboring mainland in Mexico. Under these climatic conditions, plant biomass production would be low, and only a relatively small number of animals could be supported by the habitat and food supply.
The Extinction of Life
Many species have gone extinct over the Earth's geologic history. The main reason for these extinctions is environmental change or biological competition. Since 1500, many biologically classified species have gone extinct in the wild due to the actions of humans (Figure 11.39); this includes 91 species of mammals, 169 species of birds, 73 species of amphibians and reptiles, 1002 species of fish, about 59 species of insects, and about 187 species of plants (Our World in Data). Scientists can only estimate the number of unclassified species that have gone extinct. Using various extrapolation methods, biologists estimated that about 4000 to 50,000 unclassified species went extinct in 1991 due to our activities. Most of this extinction occurred in the tropics, where species diversity is concentrated. This extinction rate is some 1000 to 10,000 times greater than the natural rate of species extinction (2 to 10 species per year) before the appearance of human beings. Human activities' continued extinction of species on our planet is one of the greatest environmental problems facing humankind. This problem and possible solutions are further discussed in Chapter 15.
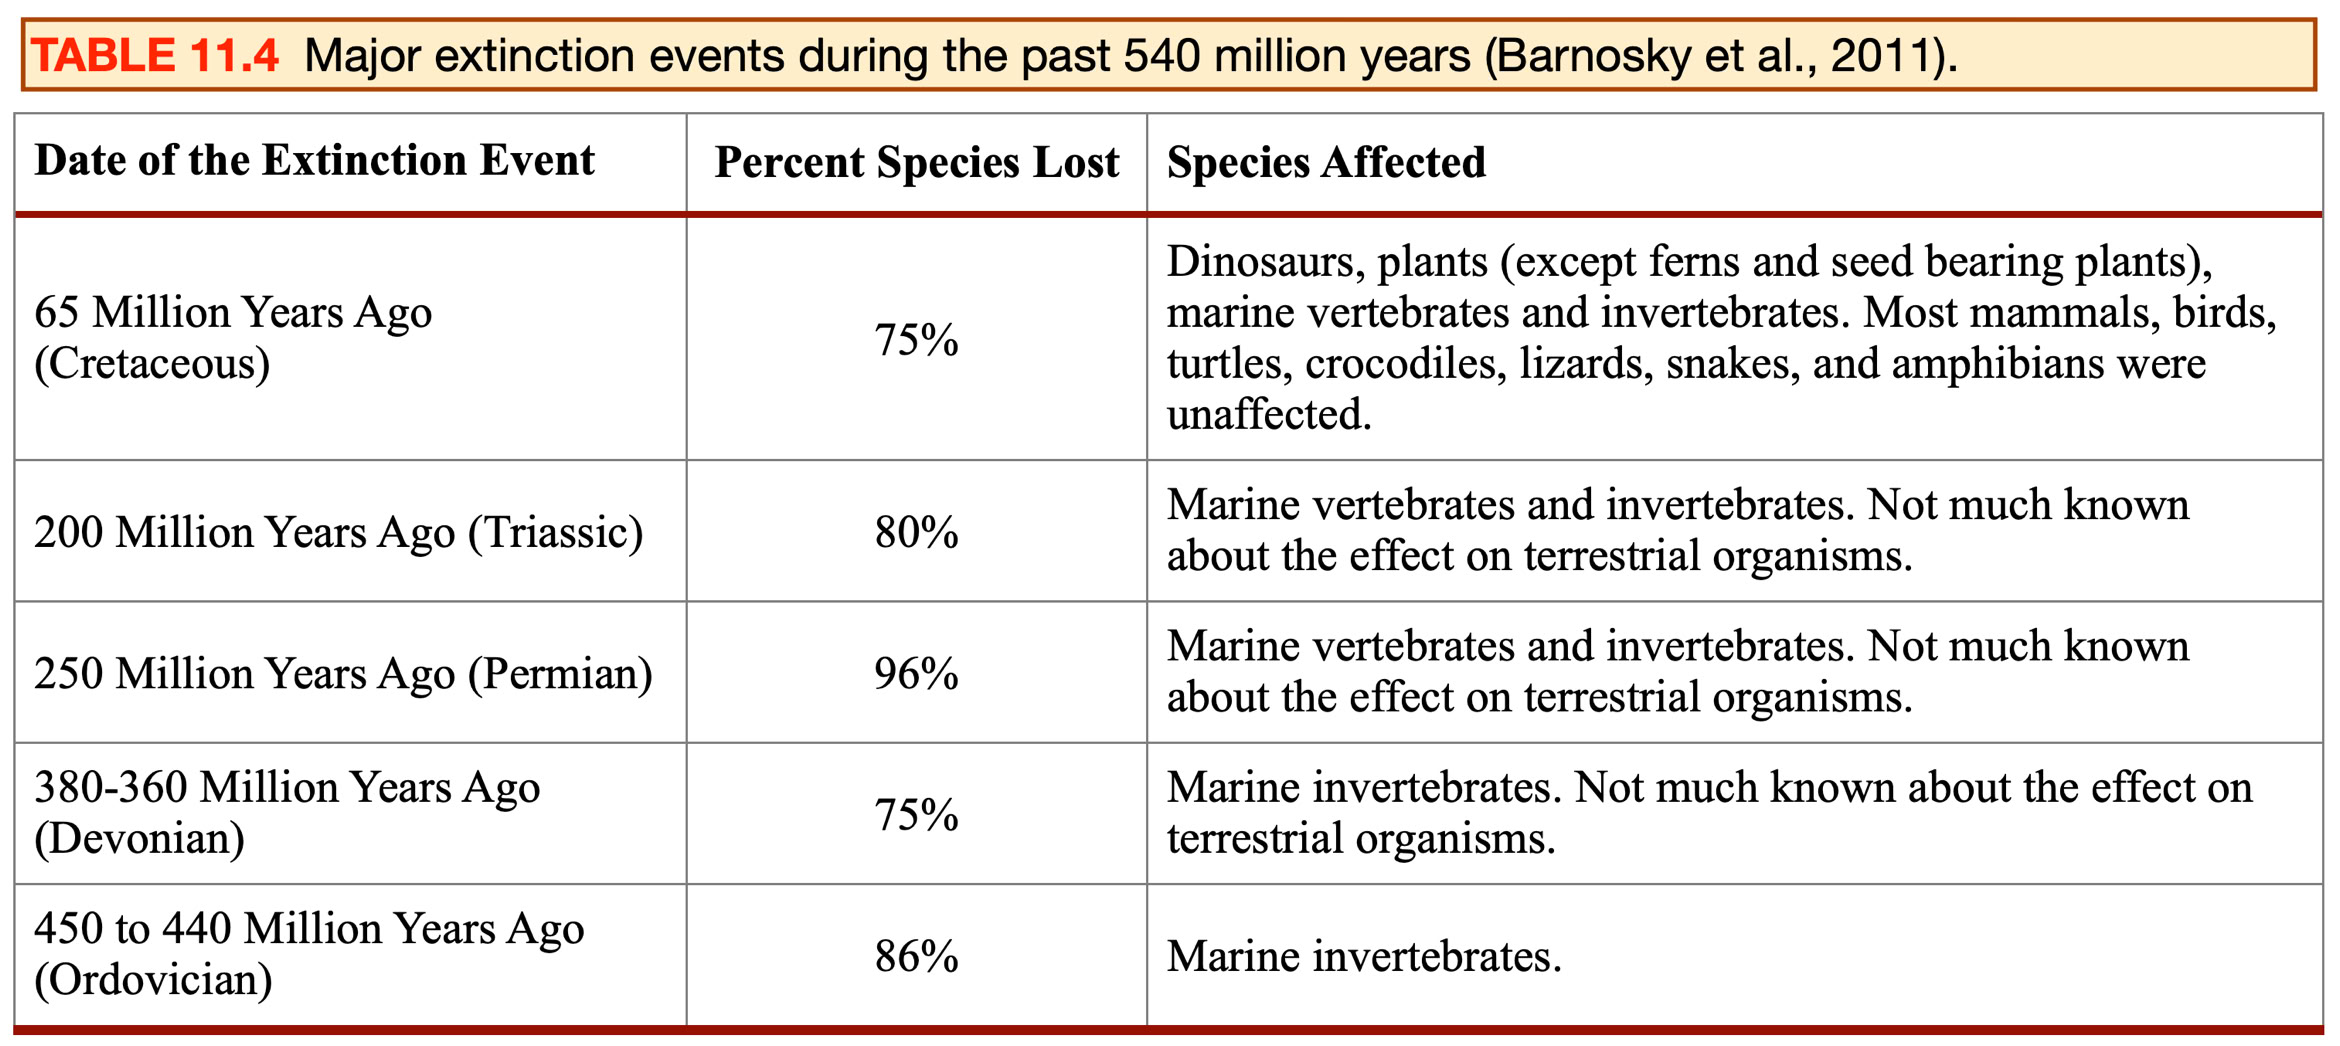
Several times in Earth's history, there have been mass extinction events, when many species went extinct over a relatively short period of geologic time (a few million years is a short time compared to Earth's age). Since the dawn of life, five mass extinctions have occurred, each eliminating between 75% and 96% of all species living just before those events (Table 26.4). Further, it is estimated that over 99% of all species that ever inhabited the Earth are now extinct. Possible explanations for past mass extinctions include climate change, volcanic activity, and asteroid collisions with the Earth.
Barnosky, A.D., N. Matzk, S. Tomiya, G.O.U. Wogan, B. Swartz, T.B. Quental, C. Marshall, J.L. McGuire, E.L. Lindsey, K.C. Maguire, B. Mersey, and E.A. Ferrer. 2011. Has the Earth’s sixth mass extinction already arrived? Nature, 471: 51-57.
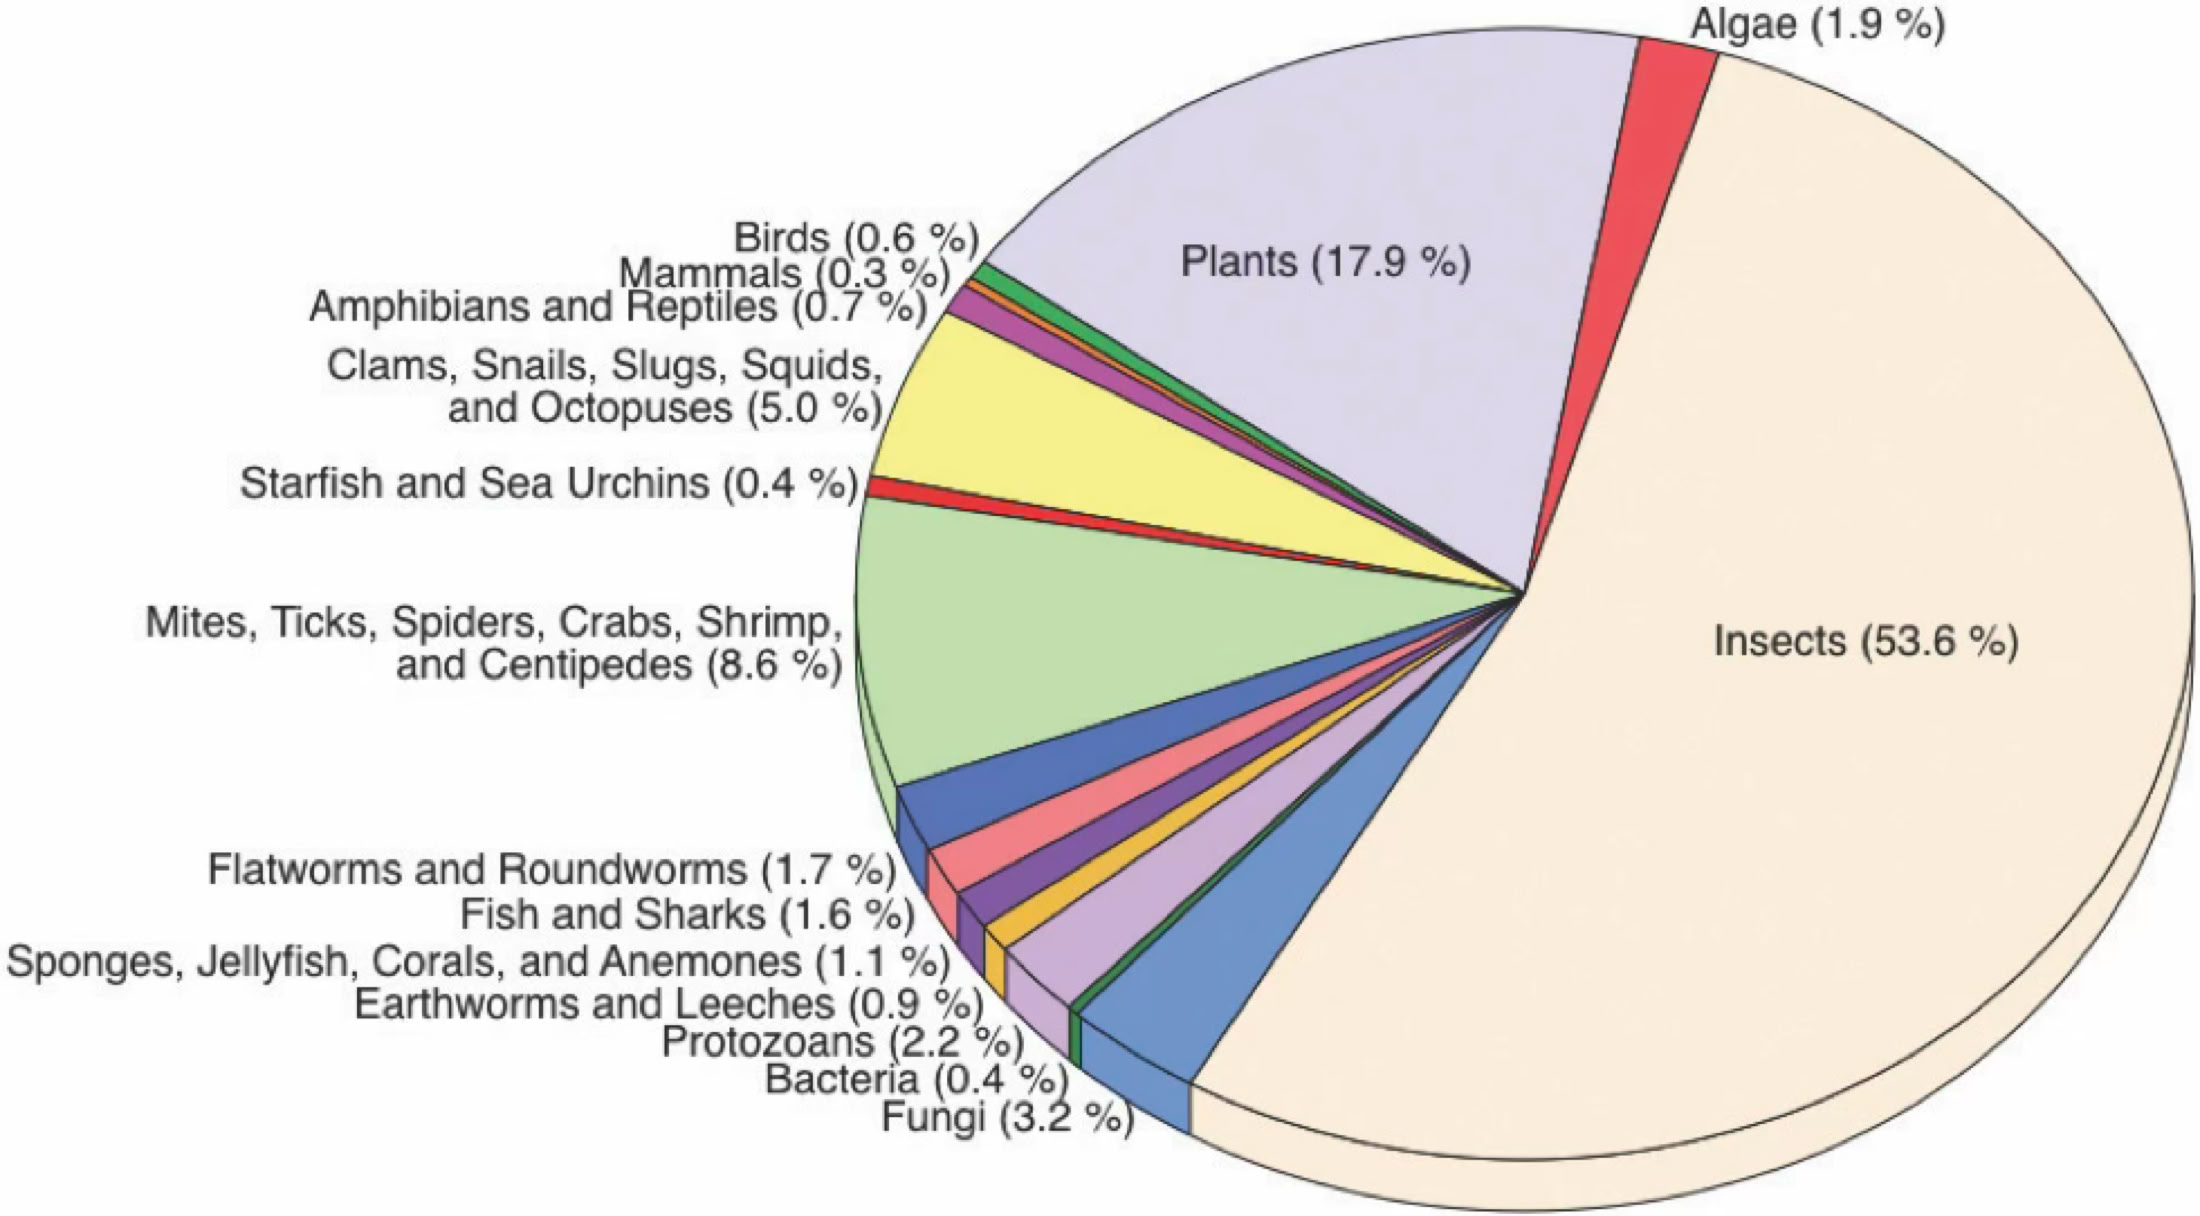
FIGURE 11.33 The relative quantity (percentage) of known species among different main organism groups. Image Copyright: Michael Pidwirny, Data Source: World Resources Institute.
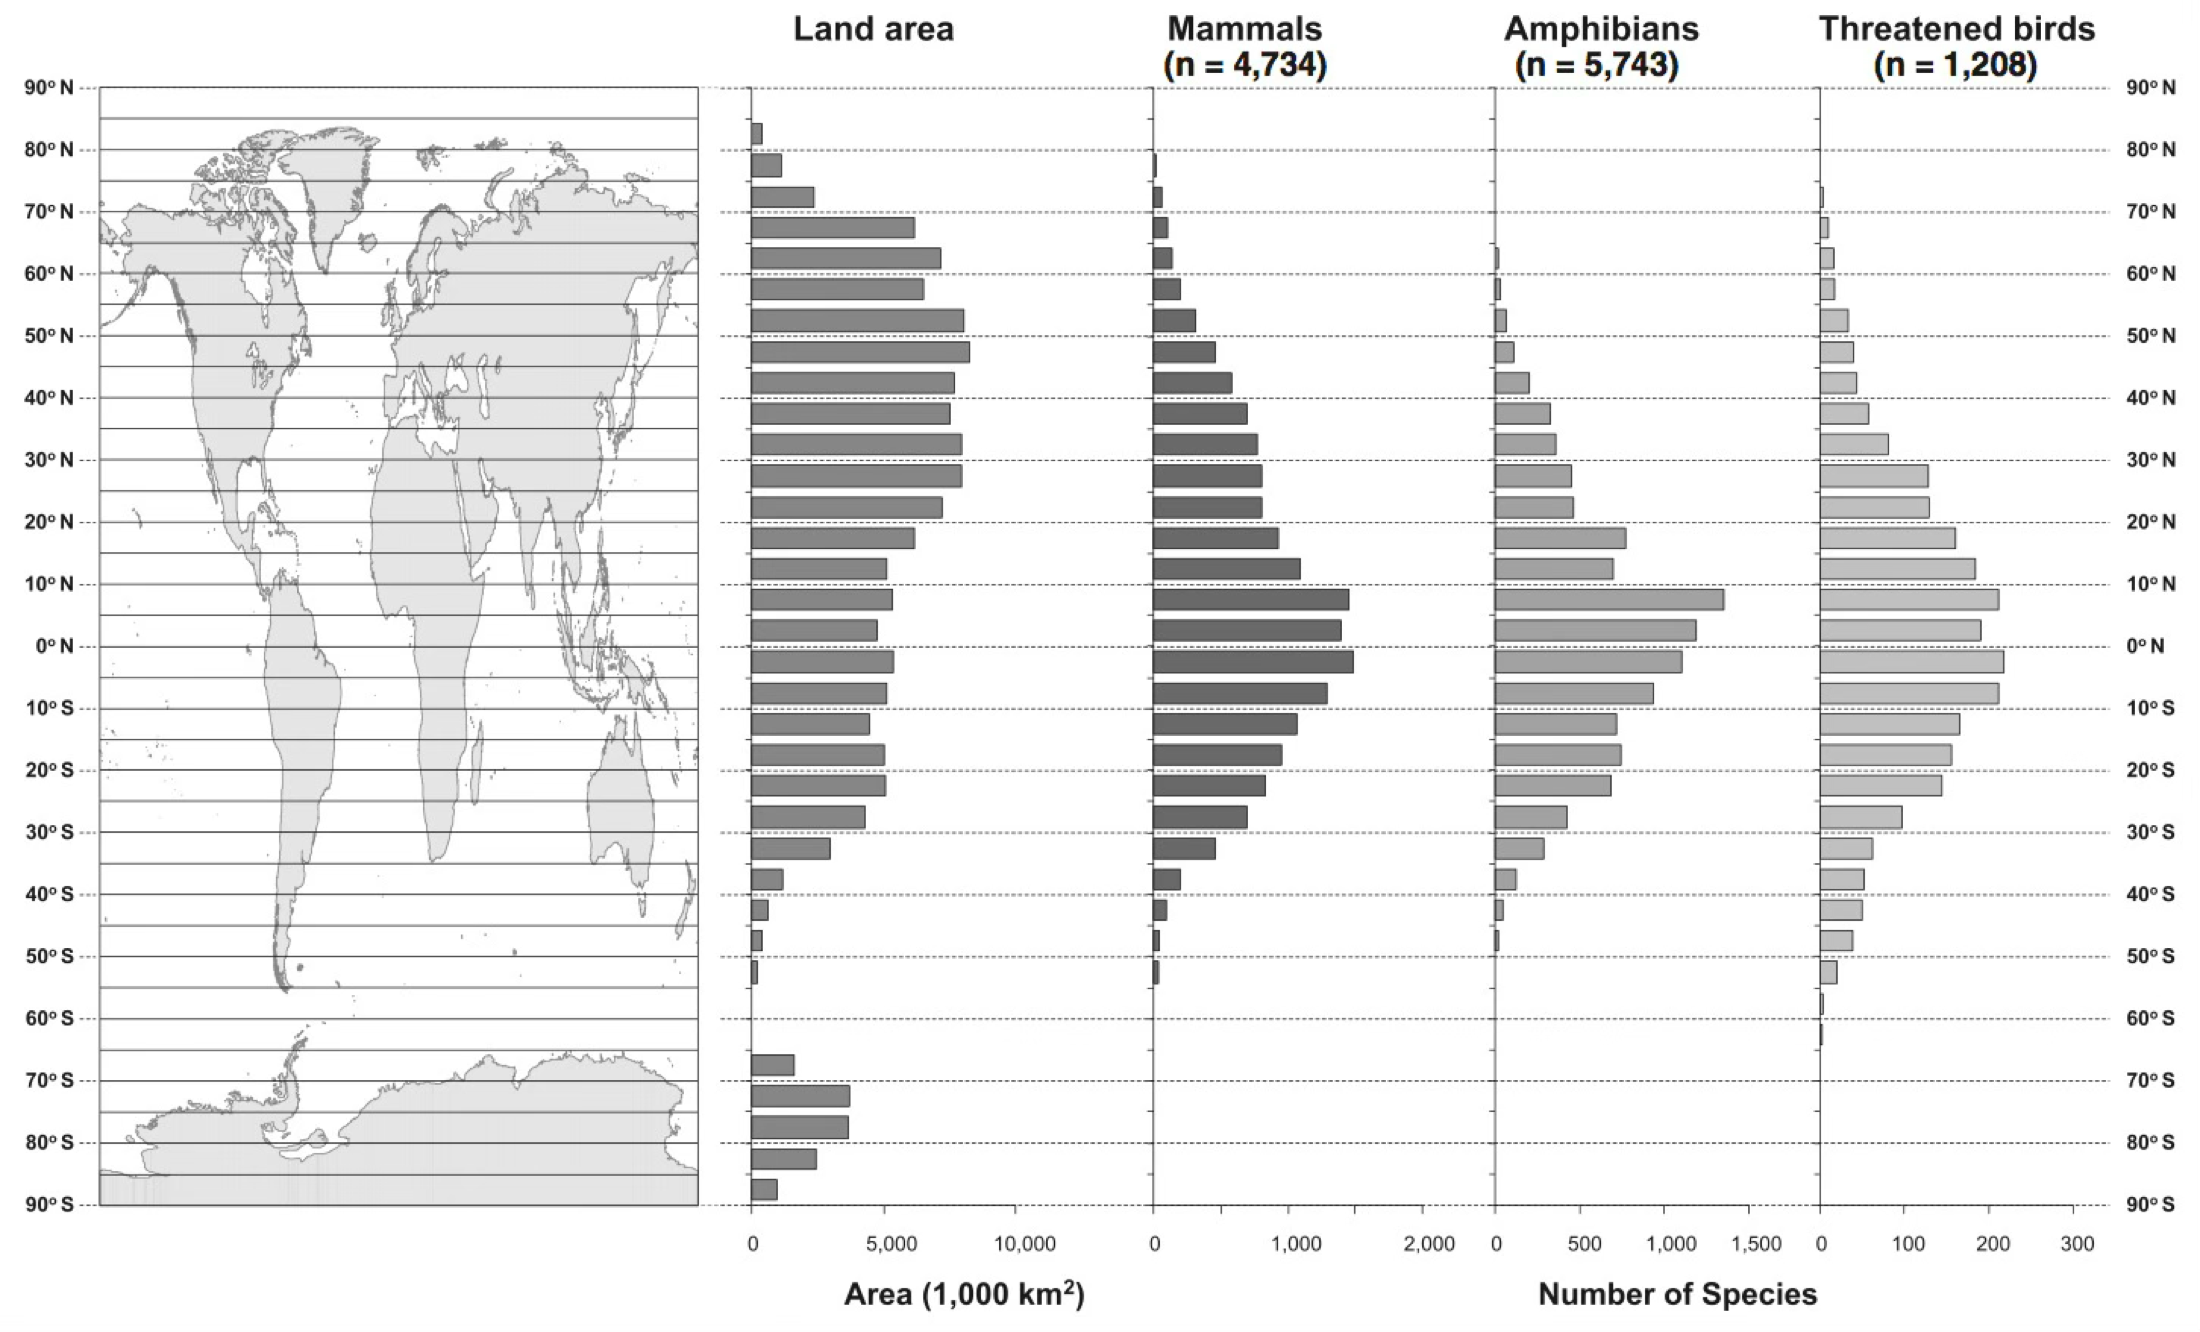
FIGURE 11.34 Differences in species numbers with latitude for three organism types: Mammals; Amphibians; and Threatened Birds. Image Source: Millennium Ecosystem Assessment, Chapter 4: Biodiversity.
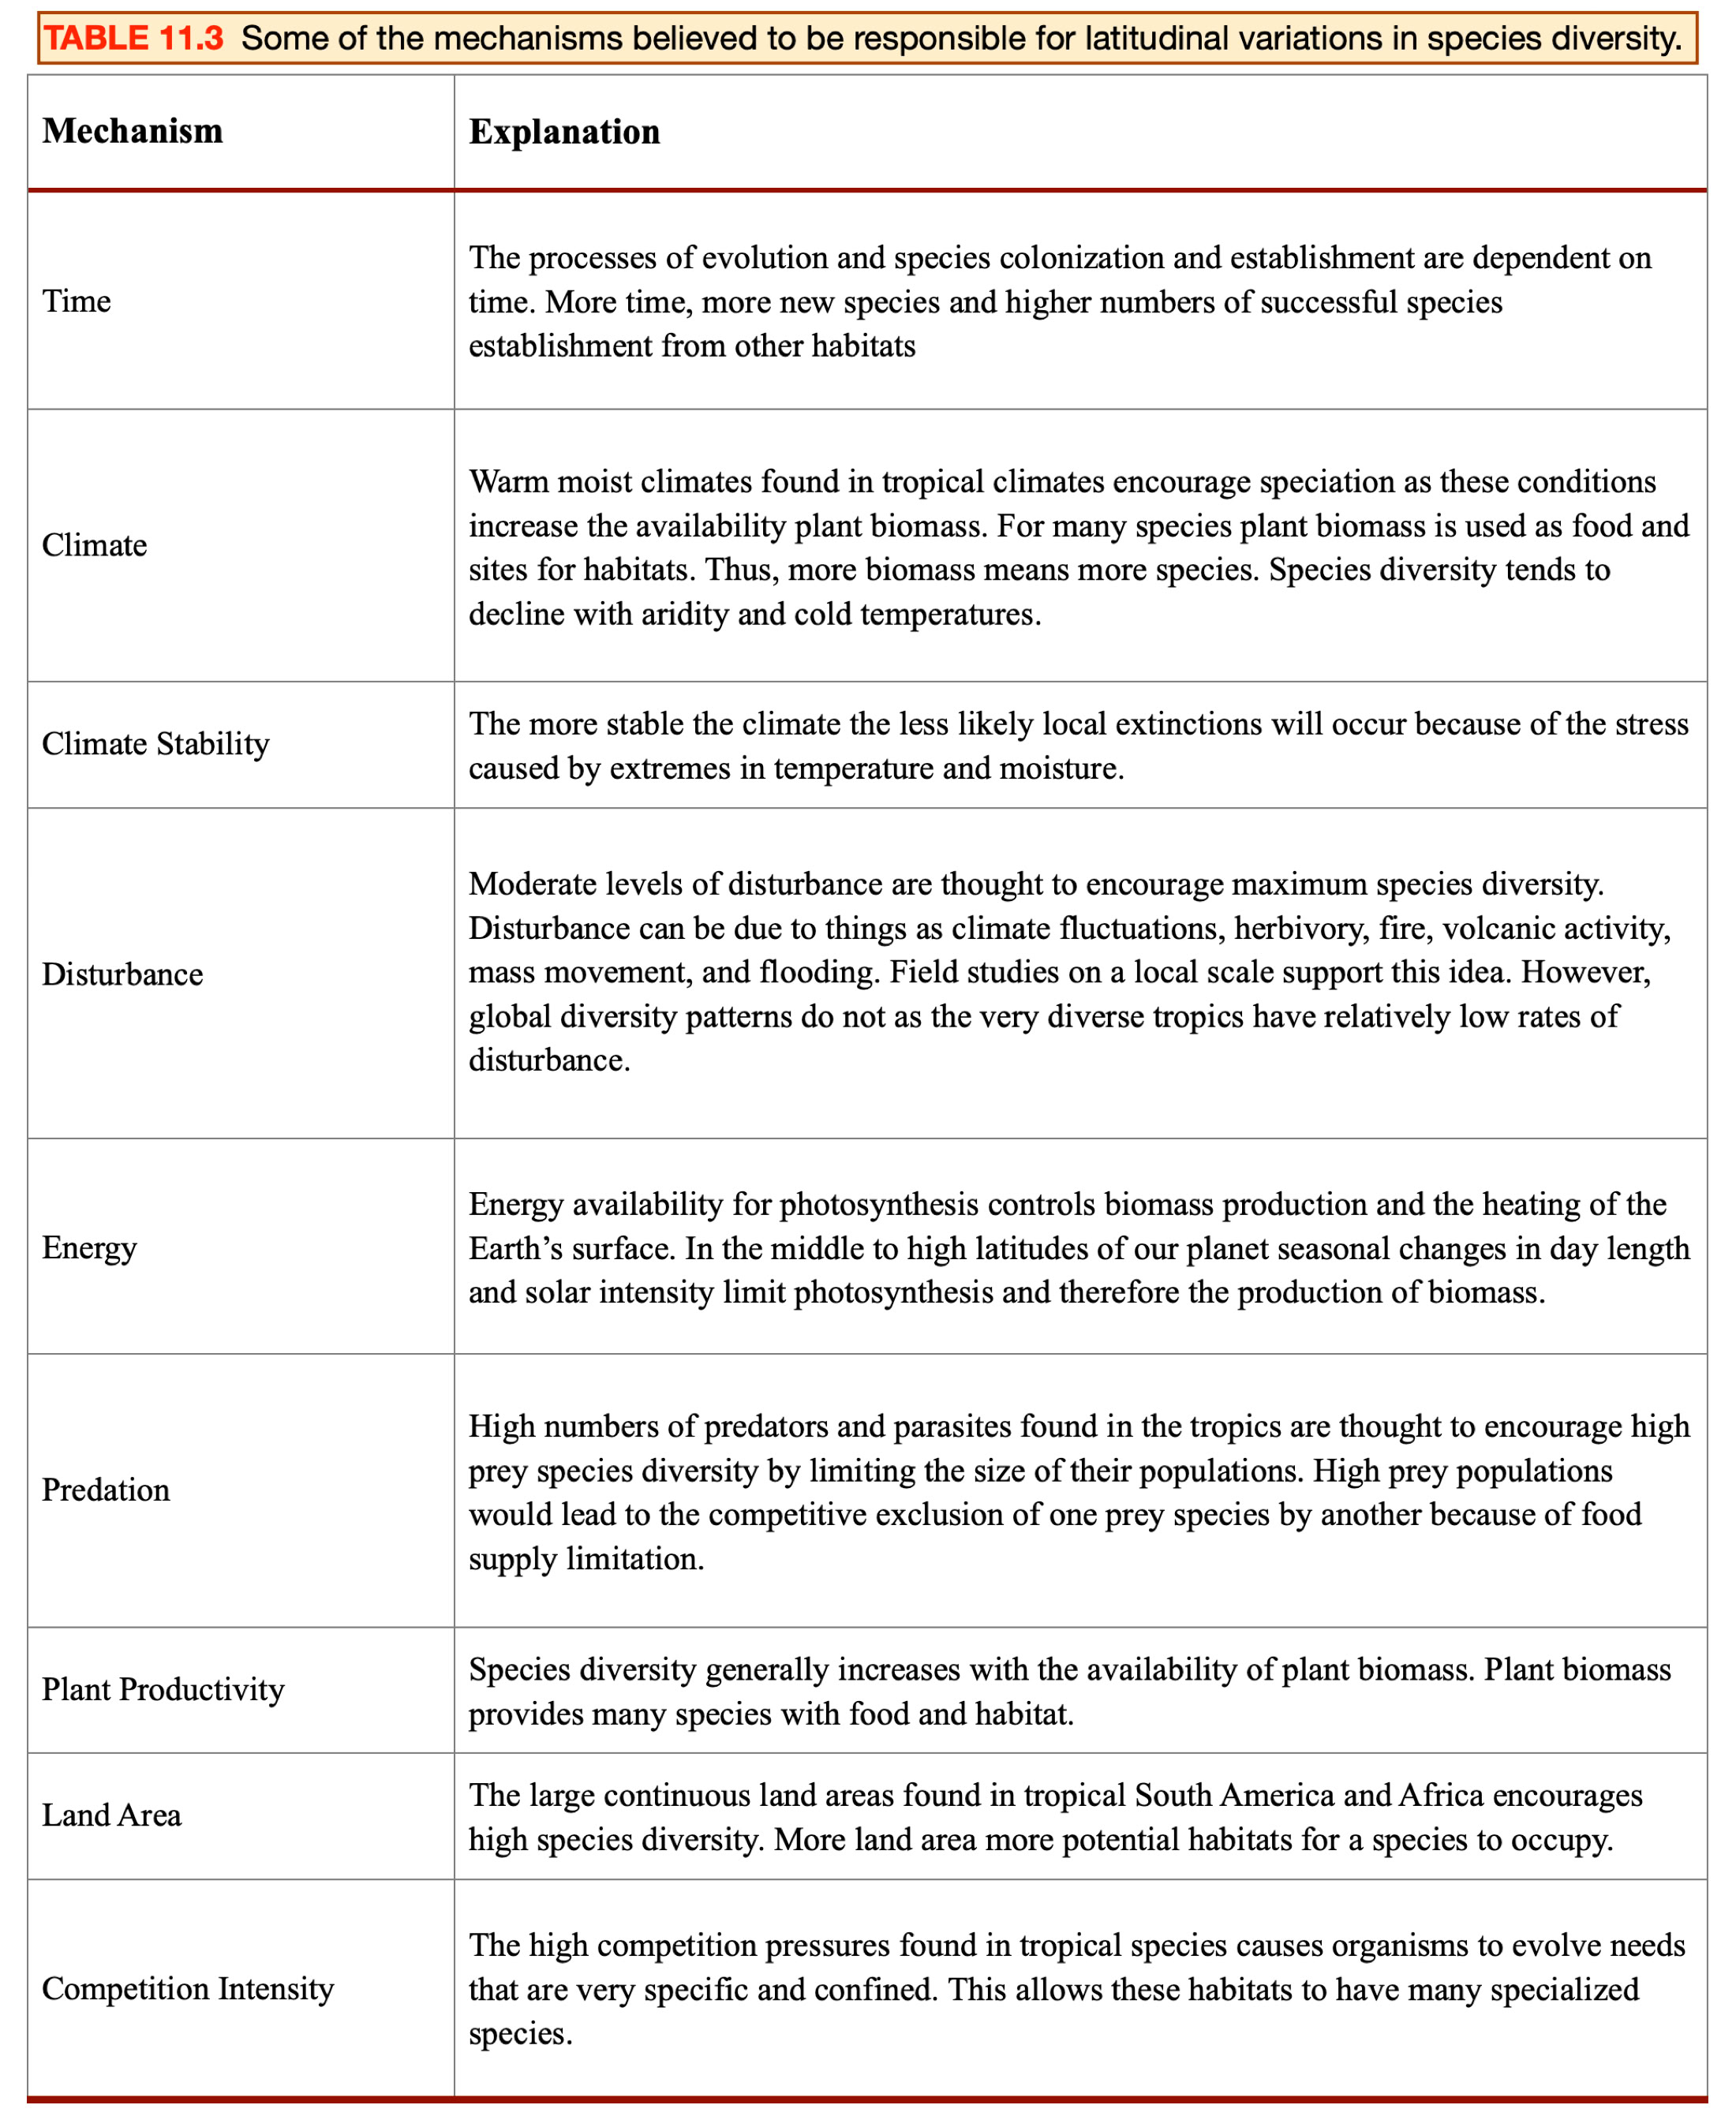
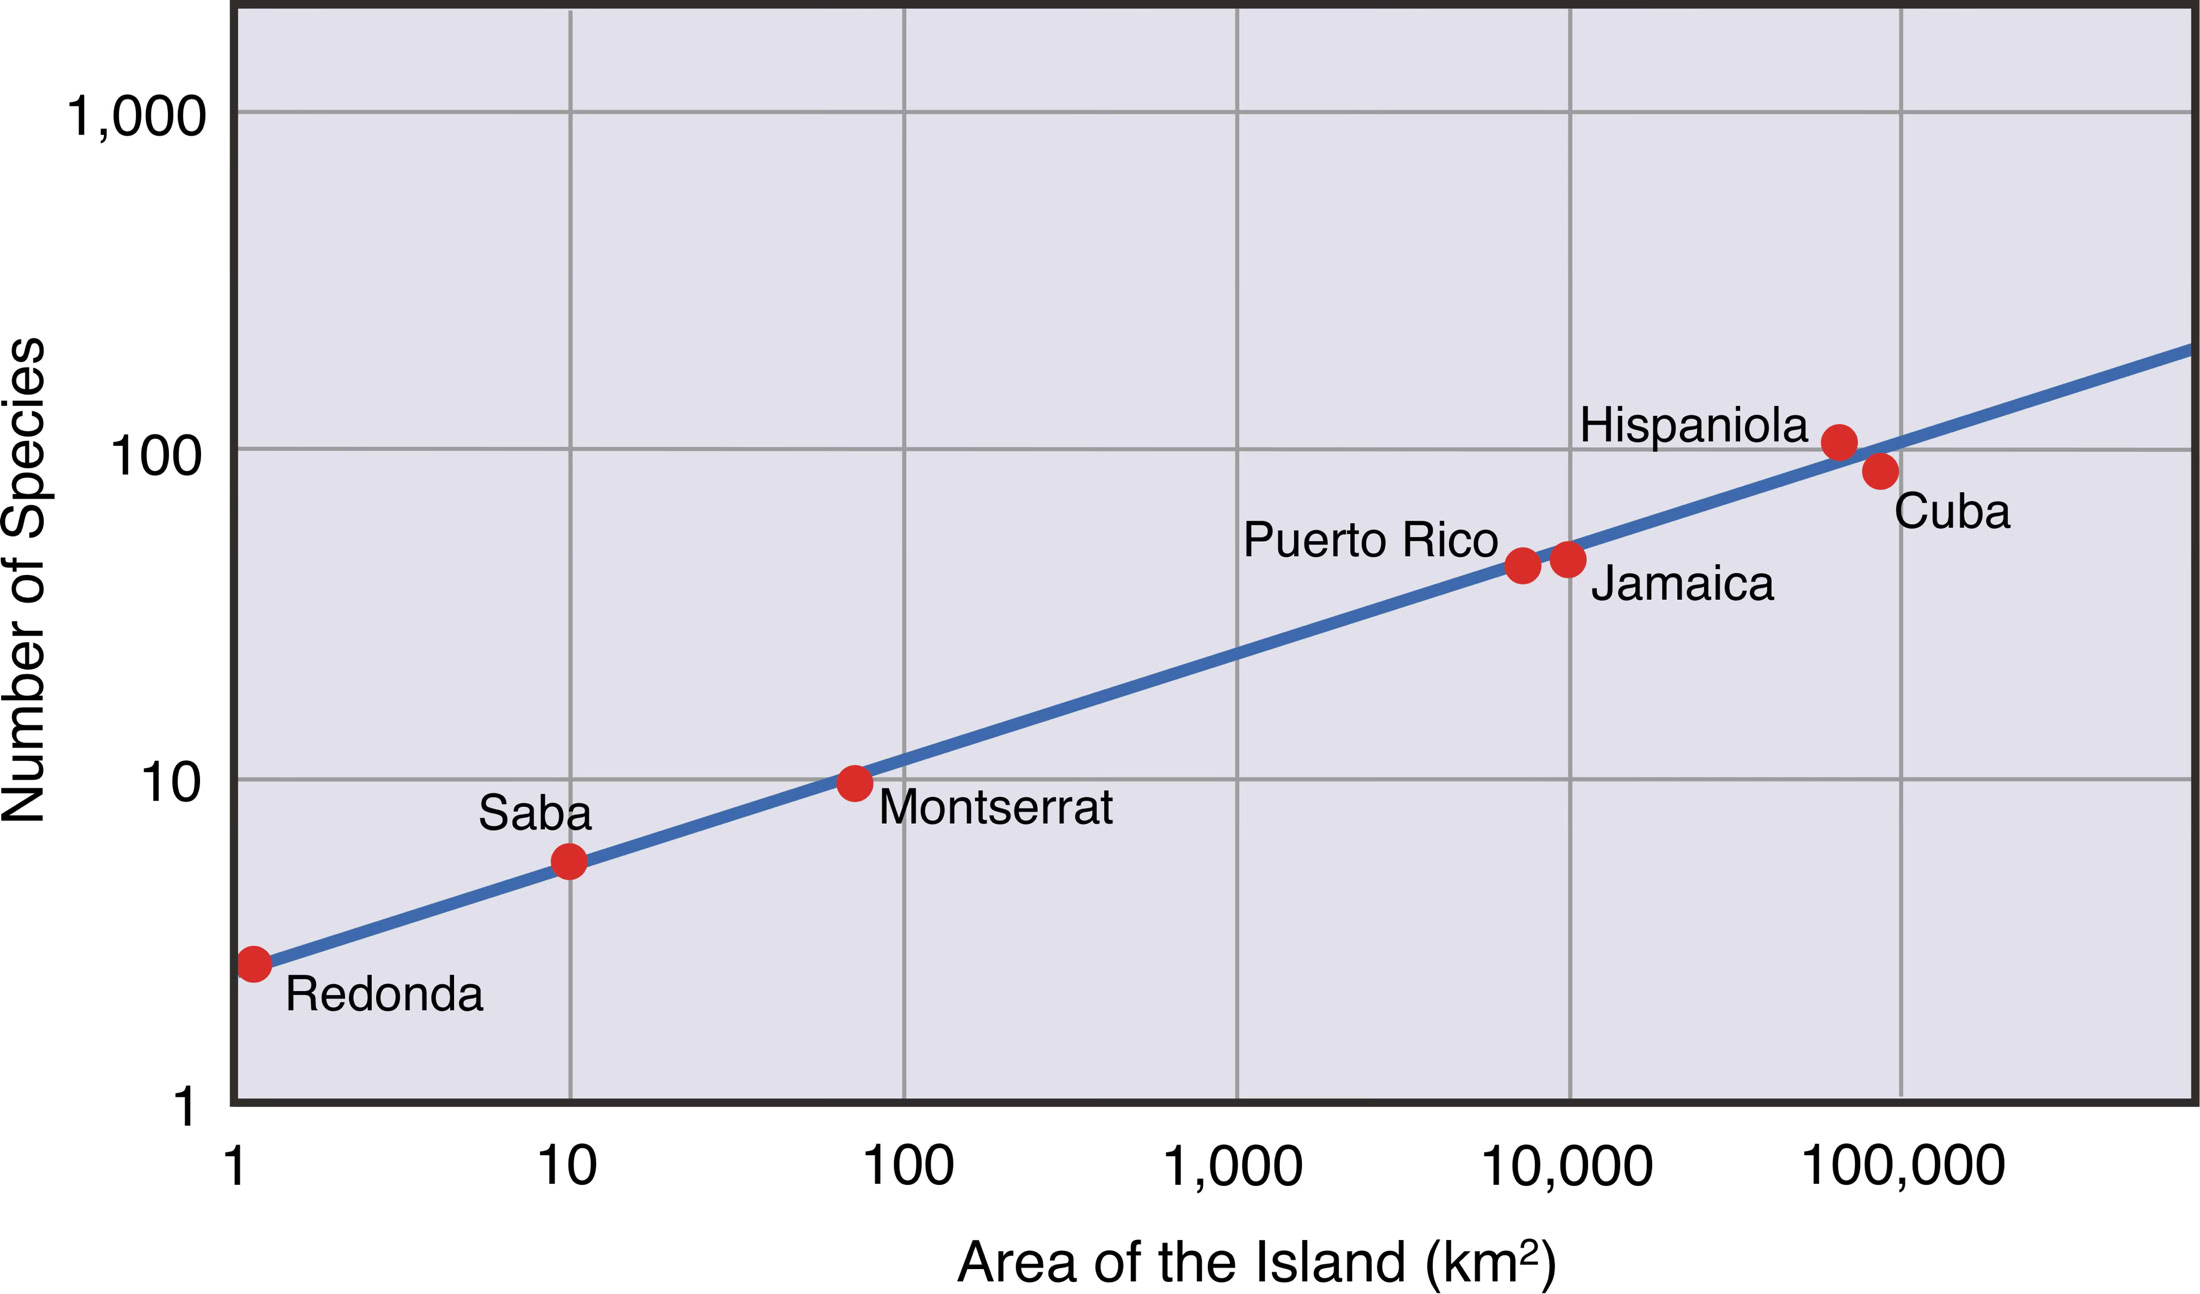
FIGURE 11.35 The island biogeography theory predicts a relationship between species number and island area. Larger islands can support more species than smaller islands because of greater habitat space. The graph above shows the species/area relationship for reptiles and amphibian species for several Caribbean Islands. Image Copyright: Michael Pidwirny, Data Source: R.H. MacArthur and E.O. Wilson. 1967. The Theory of Island Biogeography. Princeton University Press, Princeton, New Jersey.
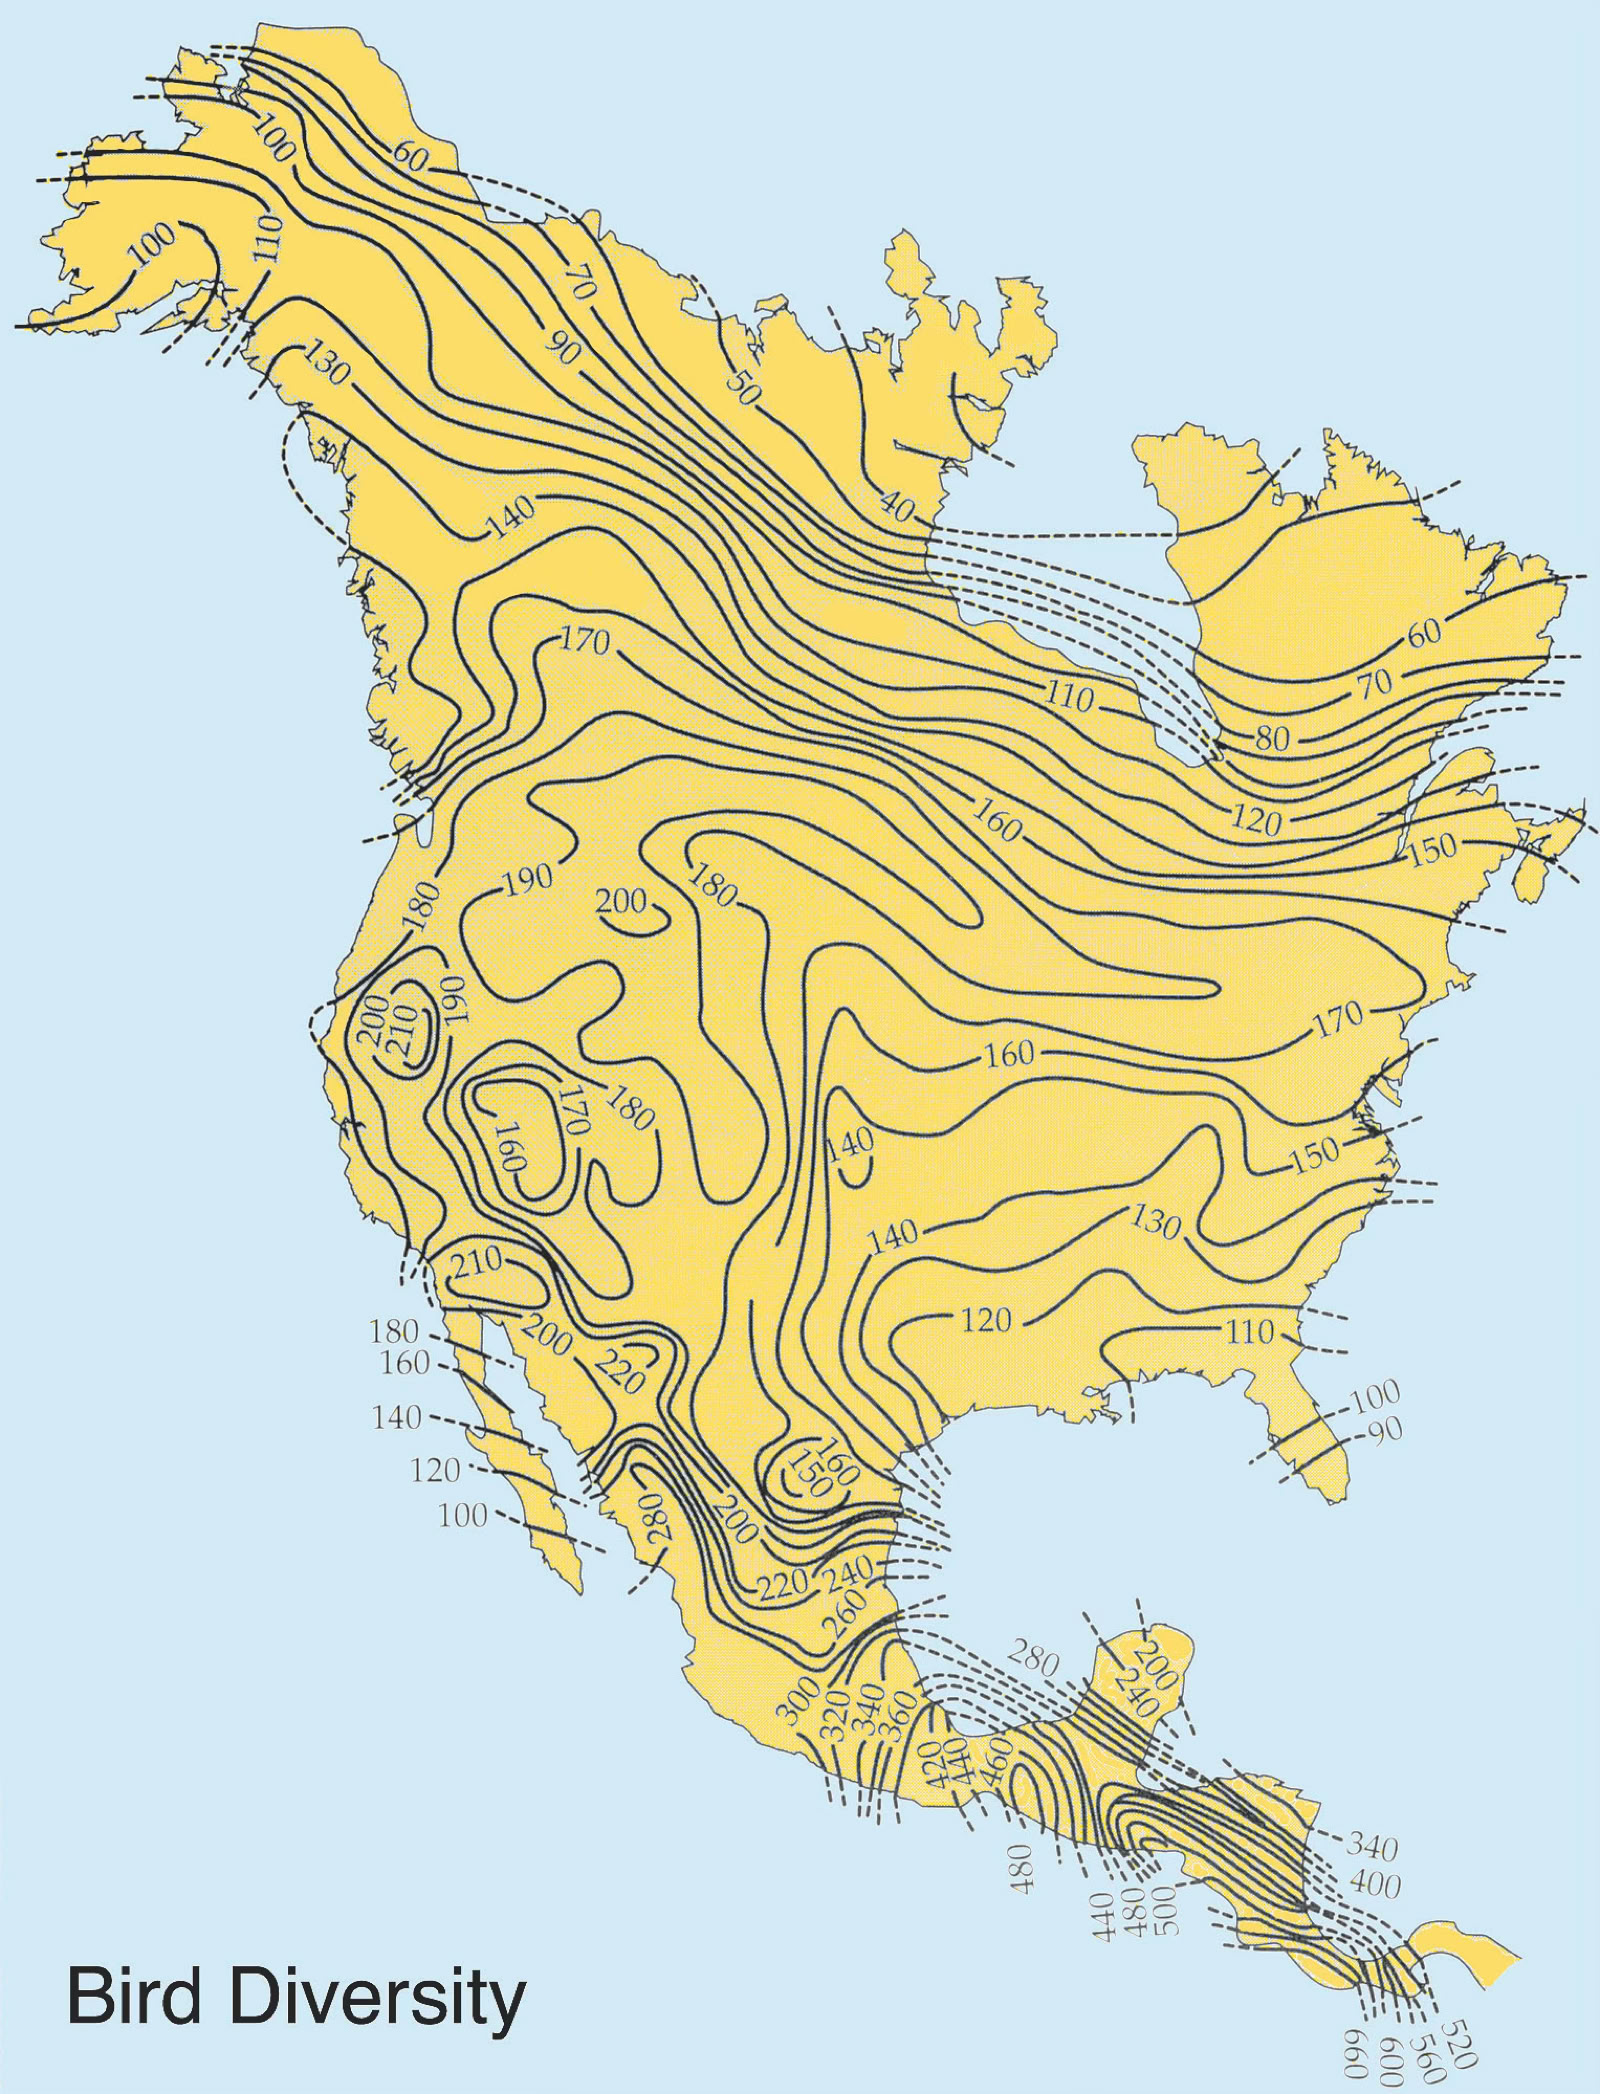
FIGURE 11.36 Geographic variation in the number of breeding land bird species in North America. Image Copyright: Michael Pidwirny, Data Source: Cook, R.E. 1969. Variation in species density of North American birds. Systematic Zoology, 18: 63-84.
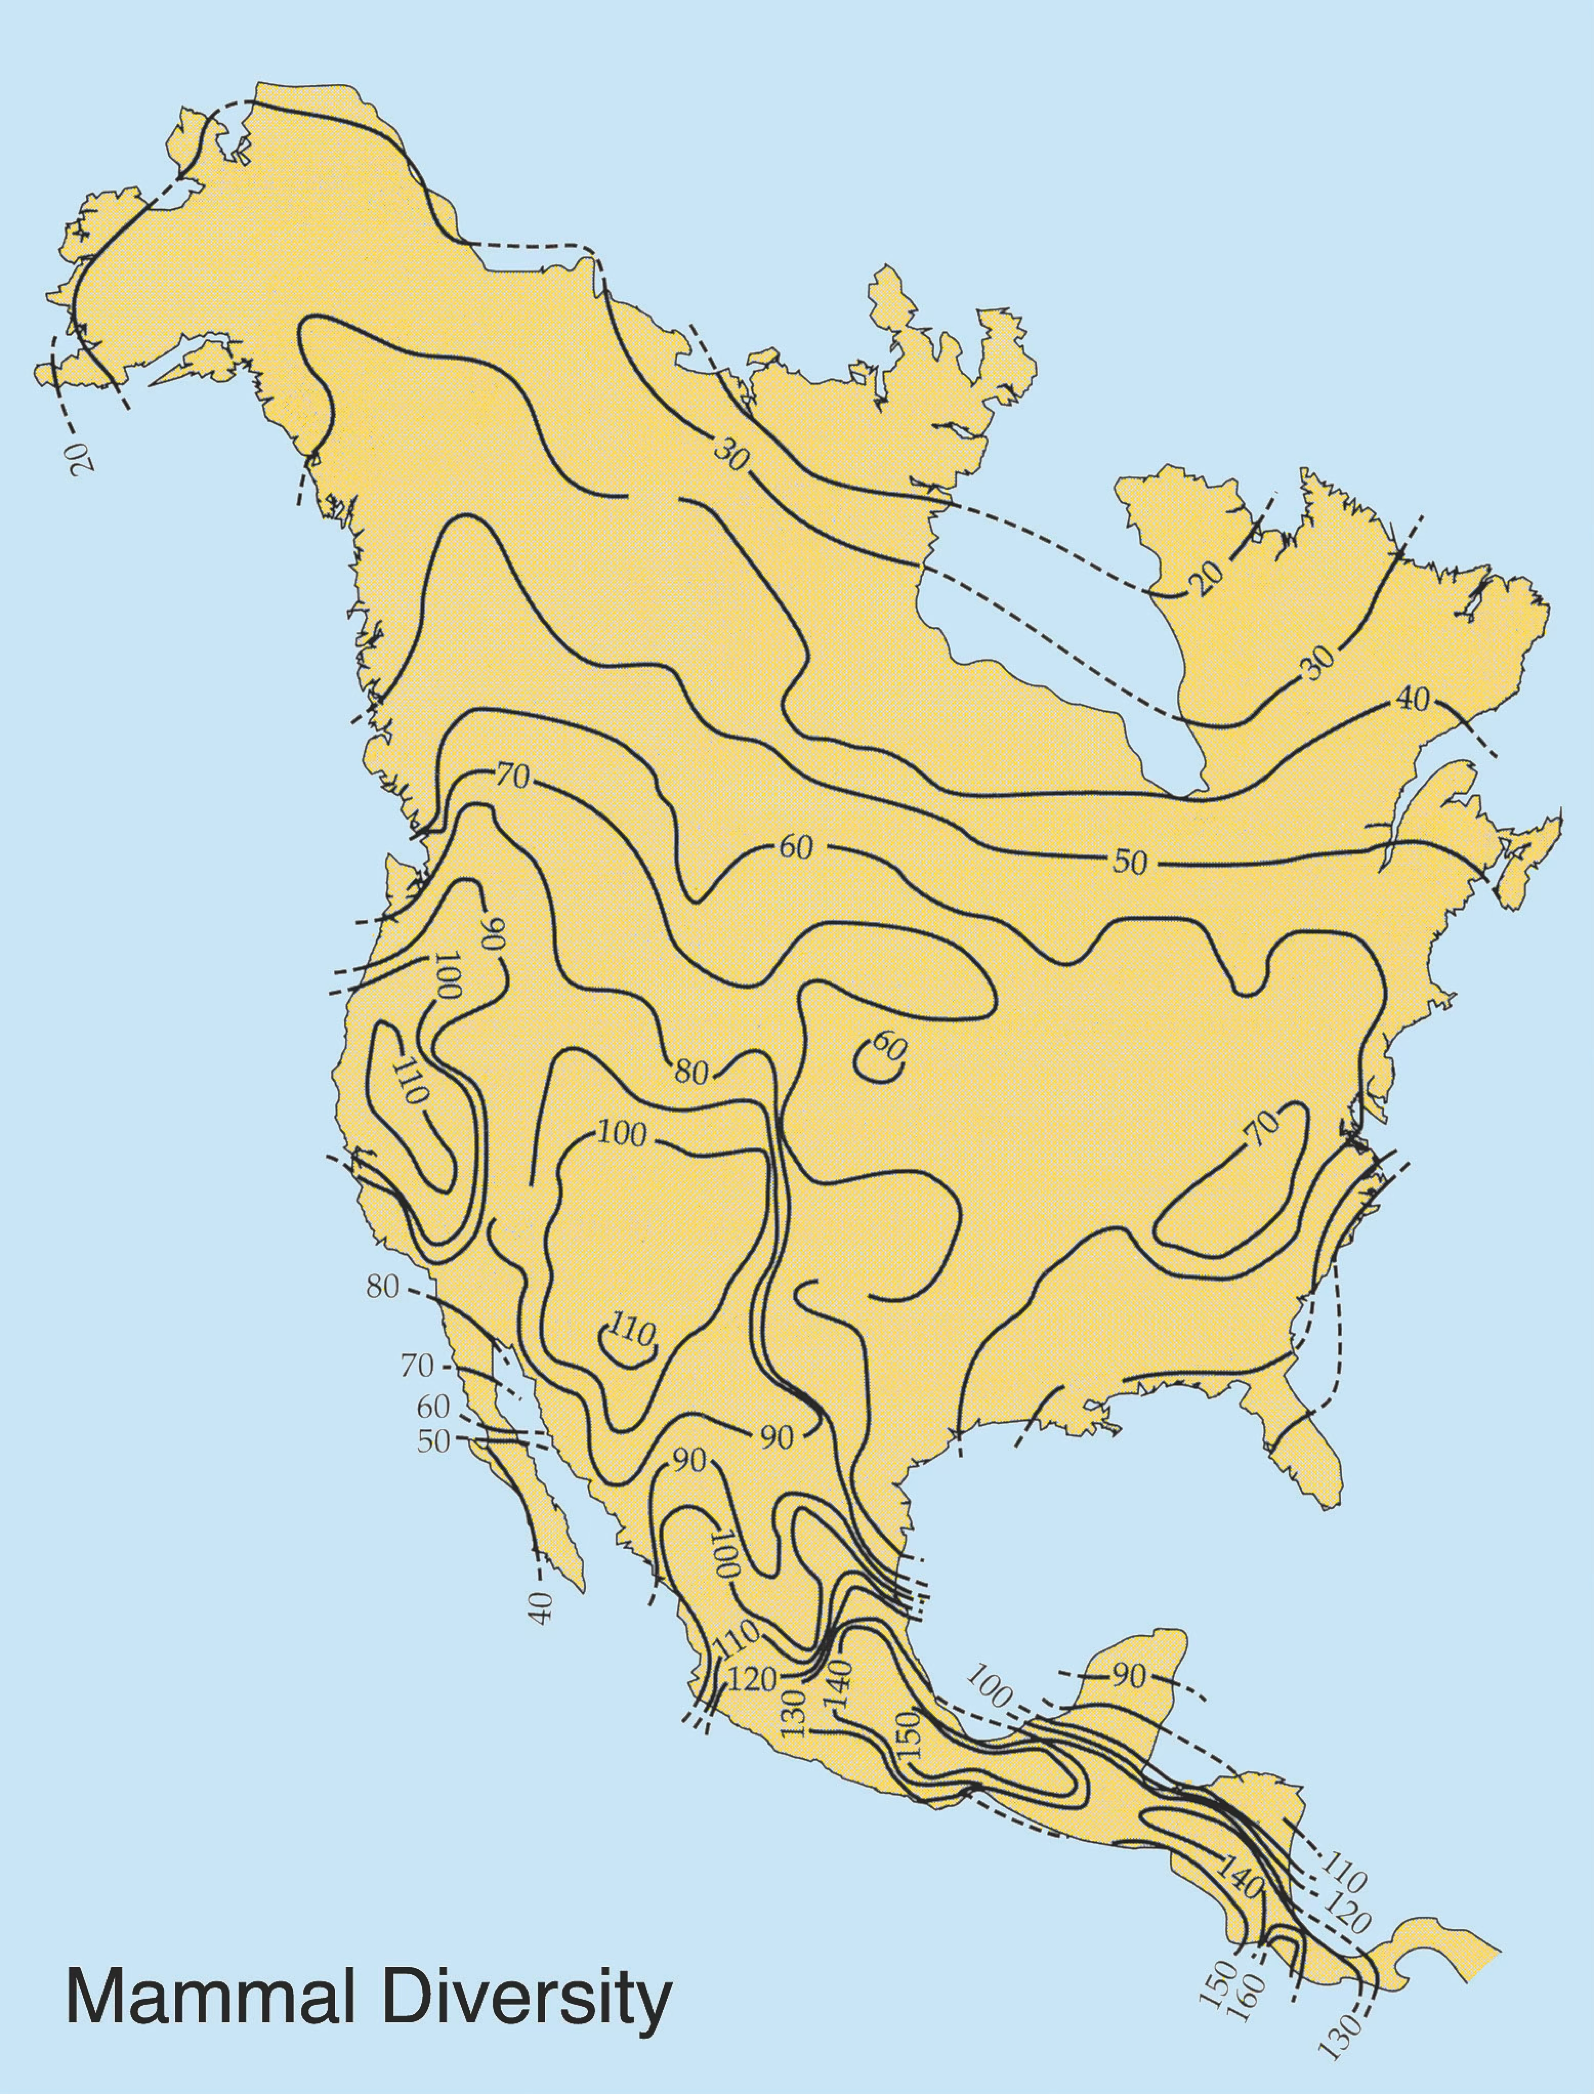
FIGURE 11.36 Geographic variation in the number of terrestrial mammal species in North America. Image Copyright: Michael Pidwirny, Data Source: Simpson, G.G. 1964. Species diversity of North American recent mammals. Systematic Zoology, 13: 57-73.
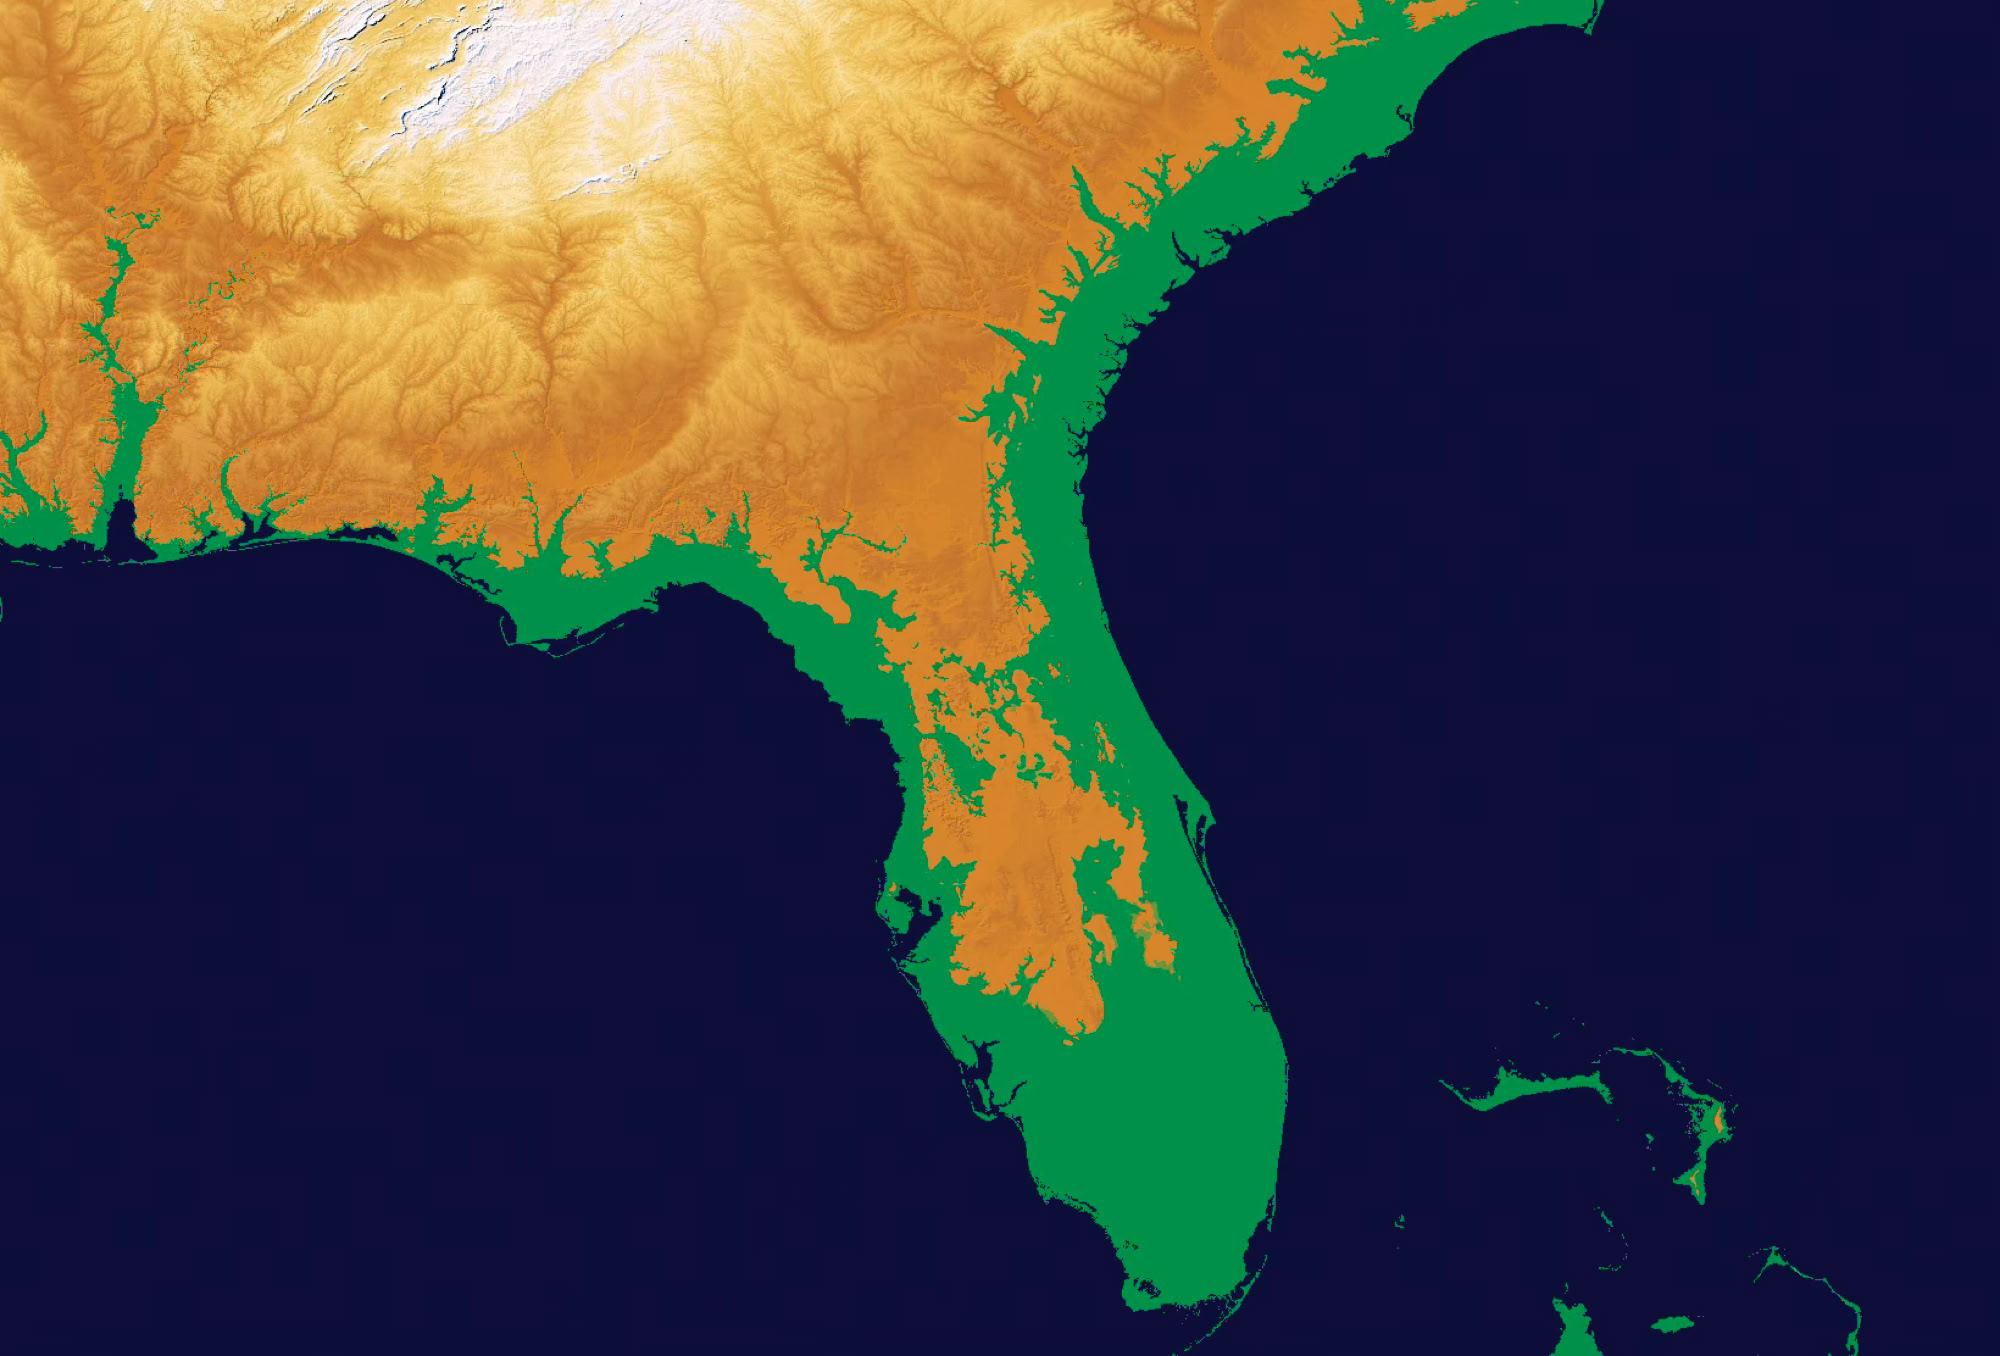
FIGURE 11.38 In the middle of the Pliocene (3 million years ago), sea level was about 35 meters (115 feet) higher than it is today. Under these conditions, much of Florida was underwater (area colored green). During the middle Pliocene, terrestrial species in Florida occupied the higher ground attached to the North American mainland and many islands (area colored orange). Image Copyright: Michael Pidwirny.
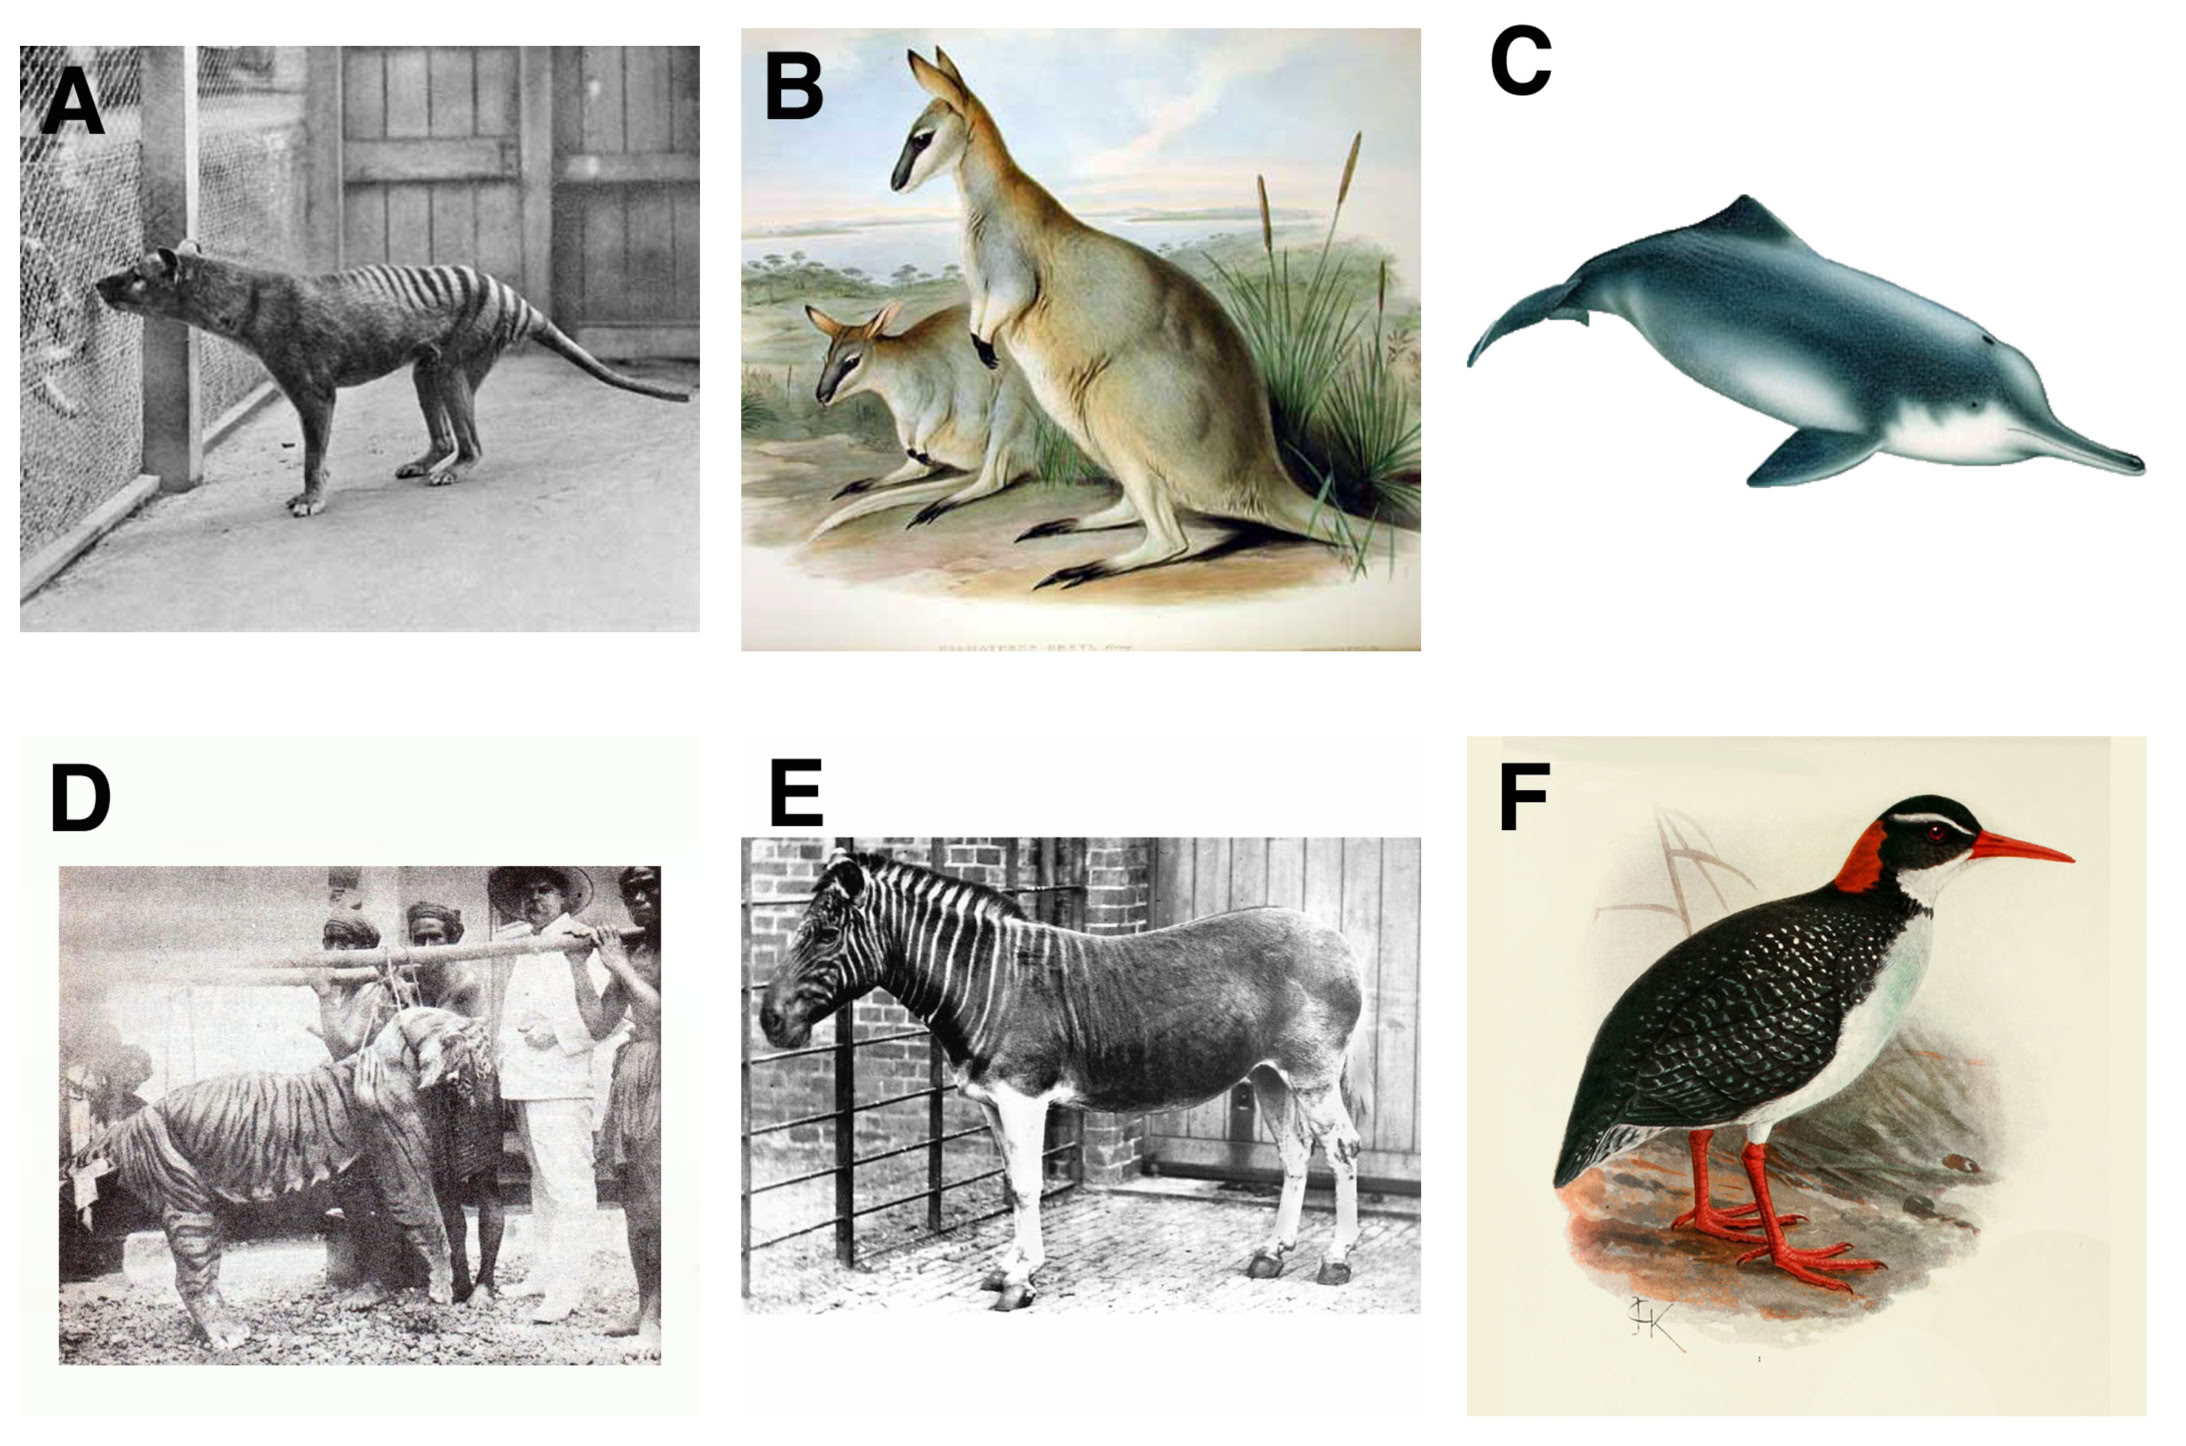
FIGURE 11.39 The following pictures show some of the species that have gone extinct in the last 300 years because of the actions of humans. A - Tasmanian Tiger (Thylacinus cynocephalus), B - Toolache Wallaby (Macropus greyi), C - Baiji (Lipotes vexillifer), D - Bali Tiger (Panthera tigris balica), E - Quagga (Equus quagga quagga), F - Tahiti Rail (Gallirallus pacificus). Image Source: Wikimedia Commons.