We can model the fate of incoming shortwave radiation from the Sun (or insolation) across the entire planet using a simple cascade diagram (Figure 5.25). This diagram quantifies the effects of surface albedo and atmospheric scattering, absorption, and reflection on the receipt of insolation at Earth's surface over one year. In this model, we begin with an input of insolation available just outside the Earth's atmosphere. For simplicity, this input is set to 100%. Of all the sunlight that passes through the atmosphere annually, only 50% of the available radiation is absorbed at the Earth's surface to do work. This energy is used to heat the Earth's surface and lower atmosphere, melt and evaporate water, and fuel photosynthesis in plants. Of the other 50%, 5% is reflected to space by the Earth's surface, 5% is backscattered, and 20% is reflected to space by clouds and atmospheric particles. The combined effect of these three energy losses back to space is 30%. This quantity represents the Earth's planetary albedo. We are now left with 20% unaccounted for. Our planet's atmospheric gases, particles, and clouds absorb this remaining amount. The total energy absorbed by the Earth's atmosphere and surface is 70% of the incoming sunlight.
Spatial Patterns of Surface Insolation Input
The insolation cascade model for the Earth helped us to visualize how the Sun’s incoming energy is partitioned. We also must appreciate that the spatial insolation patterns received at the Earth’s surface are not uniform. The combined effect of Earth-Sun relationships (angle of incidence and day length variations) and the modification of the Sun’s beam as it travels through the atmosphere produces specific global patterns. Figure 5.26 describes the insolation received on Earth for the year 1987. For this typical year, the highest values of insolation received (about 360 Wm-2) occur just outside the equator over ocean surfaces. At the equator, the more frequent presence of greater cloud cover, especially over land, reduces the amount of insolation available by about 60 to 80 Wm-2. Outside these maximum zones, insolation absorbed decreases with increasing latitude. In Earth’s polar regions, annual insolation can be as low as 50 Wm-2.
Figure 5.27 shows the patterns of insolation absorbed at the ground surface for January and July 1987. In this image, we can see the seasonal migration of the zone of maximum received insolation because of changes in Earth’s tilt relative to the Sun. For both months, solar radiation receipts generally decrease outside these maximum zones with increasing latitude. This pattern is mainly the result of Earth's geometric relationships with the Sun and their effect on the duration and intensity of solar radiation received. Locations poleward of the Arctic Circle (66.5°N) and the Antarctic Circle (66.5°S) have insolation values of zero in January and July, respectively. At these times, these areas of the world are completely dark.
Concept of Radiation Balance
In Chapter 4, we learned that a one-to-one relationship exists between an object’s ability to absorb and emit radiation. As a result of this relationship, the absorption of solar radiation by the Earth should be balanced by the emission of a similar quantity of radiation back to space; however, the quality or wavelength of this emission may differ. The wavelength of emission is controlled by temperature, and the Earth’s temperature is much lower than the Sun’s. Our planet’s emission spectrum is in the infrared band, and the wavelength of maximum emission is at about 10 µm.
Earth Space Bound Emission
Figure 5.28 describes the annual space-bound longwave radiation emission that occurs from the Earth’s ground surface and atmosphere. Note that these output patterns do not mirror the patterns of input seen in Figure 5.26. Longwave output from our planet tends to be more evenly spread out than shortwave input. This finding suggests that after the Earth’s surface and atmosphere absorb the Sun’s radiation, other mechanisms redistribute some of this energy around the planet. These mechanisms include the greenhouse effect and the transfer of heat energy by the horizontal circulation of the atmosphere and ocean waters. We will explore these phenomena in greater detail in the upcoming chapters.
Outgoing longwave radiation in Figure 5.28 is greatest where skies are generally clear, and surface temperatures are high. Low emission values are associated with cooler surface temperatures and/or cloud cover. Clouds block some of the longwave radiation from reaching space because of the presence of water. Both water vapor and liquid water droplets can absorb infrared emissions. This absorbed energy is then reradiated in the atmosphere, and most of this emission is returned to the Earth’s surface.
The patterns of combined surface and atmosphere outgoing longwave emissions for January and July are shown in Figure 5.29. Seasonal variations in Earth's longwave output tend to be subtle. In January, longwave emissions from the middle and high latitudes of the Northern Hemisphere are lower than those from the same locations in the Southern Hemisphere. Southern Hemisphere locations emit more longwave because they are experiencing summer and higher temperatures at that time. Summer in the Northern Hemisphere occurs in July. During this month, middle and high-latitude locations north of the equator emit more outgoing longwave than the same regions in the Southern Hemisphere.
Annual Global Radiation Cascades
To better understand the balance between incoming and outgoing energy, we need to model the processes involved in global shortwave and longwave radiation cascade diagrams. Figure 5.30 illustrates a slightly more complex version of the annual global shortwave radiation cascade. This model suggests that as the Sun's energy passes through our atmosphere, several things occur. About 25 units of the energy available are reflected or scattered back to space by clouds and particles. Atmospheric absorption by clouds, gases (like ozone), and particles consumes another 20 units. A large amount of this absorption (17 out of 20 units) occurs in the troposphere, where most of the atmosphere's mass resides. Of the remaining 55 units, 5 units are reflected from the ground surface to space. On average, about 50 units of the Sun's radiation reach the surface. This energy is then used in several processes, including heating the ground surface and the lower atmosphere, melting ice and snow, evaporating water, and plant photosynthesis.
Figure 5.31 describes the global longwave radiation cascade. This cascade indicates that energy leaves the Earth's surface through three processes: longwave surface emissions of radiation and the creation of sensible and latent heat. Seven units leave the surface as sensible heat. This heat is transferred into the atmosphere by conduction, convection, and advection (sensible heat flux). The evaporation of water at the Earth's surface incorporates 23 units of energy into the atmosphere as latent heat. This energy is released into the atmosphere when water condenses or solidifies (latent heat flux). Eventually, both sensible and latent heat are incorporated into the emission of longwave radiation by the atmosphere and its clouds.
The Earth's surface emits 114 units of longwave radiation (Figure 5.31). Of this emission, only 12 units are directly lost to space. The other 102 units are absorbed by greenhouse gases, which convert them into heat energy. This heat energy is then converted into longwave radiation emitted by the atmosphere. The atmosphere emits a total of 152 units of longwave energy. The additional 50 units of longwave energy (152 – 102 = 50) entered the atmosphere by way of three processes:
- Absorption of shortwave radiation from the Sun by gases and aerosols. In a previous section, we learned that 20 units of solar energythat enter the Earth's atmosphere are absorbed there (see Figure 5.30).
- Transfer of sensible heat energy from the Earth's surface into the atmosphere through conduction and upward convective movement of parcels of air.
- Transfer of latent heat energy stored in water vapor (23 units). This water was originally solid or liquid at the Earth's surface. Upon absorption of radiation, it was converted to vapor. This water vapor was then transported vertically and horizontally by atmospheric circulation. In the atmosphere, this latent energy is released when condensation and freezing occur.
Atmospheric infrared emissions travel in two directions. About 58 units of atmospheric emission are lost directly to space (Figure 5.31). The remaining 94 units travel to Earth's surface, where they are absorbed and converted to heat energy. This movement of longwave radiation back to the Earth's surface is called counter-radiation. Note that if this energy were not added back to the surface, longwave output from the ground would only be 20 units! Thus, the greenhouse effect, the re-emission of longwave radiation by greenhouse gases back to the Earth's surface, re-circulates 74 units of energy.
To balance the surface energy exchanges in the longwave cascade, we have to account for 50 units of missing energy [atmosphere and cloud longwave emission (94 units) minus surface longwave emission (114 units) plus latent heat transfer (23 units) plus sensible heat transfer (7 units) or 94 - (114 + 23 + 7) = -50 units of energy] (Figure 5.31). This missing component of the longwave radiation cascade is the 50 units of energy absorbed at the Earth's surface from direct and diffuse insolation in the shortwave cascade (see Figure 5.30). The total energy lost to space in the global longwave radiation cascade is 70 units (surface emission 12 units + atmospheric emission 58 units). These 70 units are the same amount of energy added to Earth's atmosphere and surface by the global shortwave radiation cascade.
Net Radiation
Net radiation is the total quantity of radiation across all wavelengths available to do work. We can suggest that the net radiation available at the Earth’s surface and atmosphere is composed of the following four parts:
The net radiation from Earth's surface and atmosphere should be zero because the planet is in radiative balance (input = output). Examining our planet's spatial patterns of annual net radiation indicates a geographical imbalance (Figure 5.32). Net radiation tends to be positive in the tropics and subtropics and negative in the middle and high latitudes. The zone of positive net radiation stretches from about 35°N and S with maximum values near the equator. These positive net radiation values occur because the amount of incoming shortwave radiation exceeds the outgoing longwave radiation. Within this zone of positive values, some areas are irregular. Net radiation is negative in the Sahara Desert, the Arabian Peninsula, and central Australia. Because of clear skies, these locations experience significant longwave radiation loss to space. Areas of localized deficit also occur in the subtropical oceans just off the western coasts of South and North America. Again, these deficits are attributed to the general absence of cloud cover.
Zones of negative net radiation extend from 35°N to 90°N and 35°S to 90°S. The amount of outgoing longwave radiation inside these zones exceeds incoming shortwave radiation. These outgoing longwave emissions are driven by the net radiation surplus between 35°N and 35°S. As mentioned previously, the latitudinal transfer of sensible and latent heat by the atmospheric circulation and ocean currents redistributes the surplus energy generated in the tropics to the poles. If this energy redistribution did not occur, temperatures would increase at low latitudes and decrease at high latitudes.
Figure 5.33 describes global patterns of net radiation for January and July 1987. This figure captures the effect of the Sun's seasonal migration on Earth’s net radiation balance. In January, most of the Southern Hemisphere experiences positive net radiation due to higher Sun angles and longer summer days; this zone shifts to the Northern Hemisphere in July.

FIGURE 5.25 Average annual global partitioning of incoming solar radiation. Approximately 50% of the radiation from the Sun is absorbed at the Earth’s surface as direct and diffuse light. Of the remaining 50%, about 20% is absorbed by clouds and other atmospheric gases and particles. Roughly 30% is returned to space through surface reflection (5%), atmospheric backscattering (5%), and reflection from clouds (20%). Image Copyright: Michael Pidwirny.

FIGURE 5.26 Annual absorption of insolation at the Earth’s surface and in the atmosphere for 1987 as measured by sensors aboard various satellites for NASA’s Earth Radiation Budget Experiment (ERBE). Cells with missing data are colored white. Image Source: NASA - Earth Radiation Budget Experiment.

FIGURE 5.27 Absorption of insolation at the surface and in the atmosphere of the Earth for January and July 1987 as measured by sensors aboard various satellites for NASA’s Earth Radiation Budget Experiment (ERBE). Cells with missing data are colored white. Image Source: NASA - Earth Radiation Budget Experiment.

FIGURE 5.28 Annual space-bound emission of longwave radiation from the surface and atmosphere of the Earth for 1987 as measured by sensors aboard various satellites for NASA’s Earth Radiation Budget Experiment (ERBE). Image Source: NASA - Earth Radiation Budget Experiment.

FIGURE 5.29 Space-bound emission of longwave radiation from the surface and atmosphere of the Earth for January and July 1987 as measured by sensors aboard various satellites for NASA’s Earth Radiation Budget Experiment (ERBE). Image Source: NASA - Earth Radiation Budget Experiment.
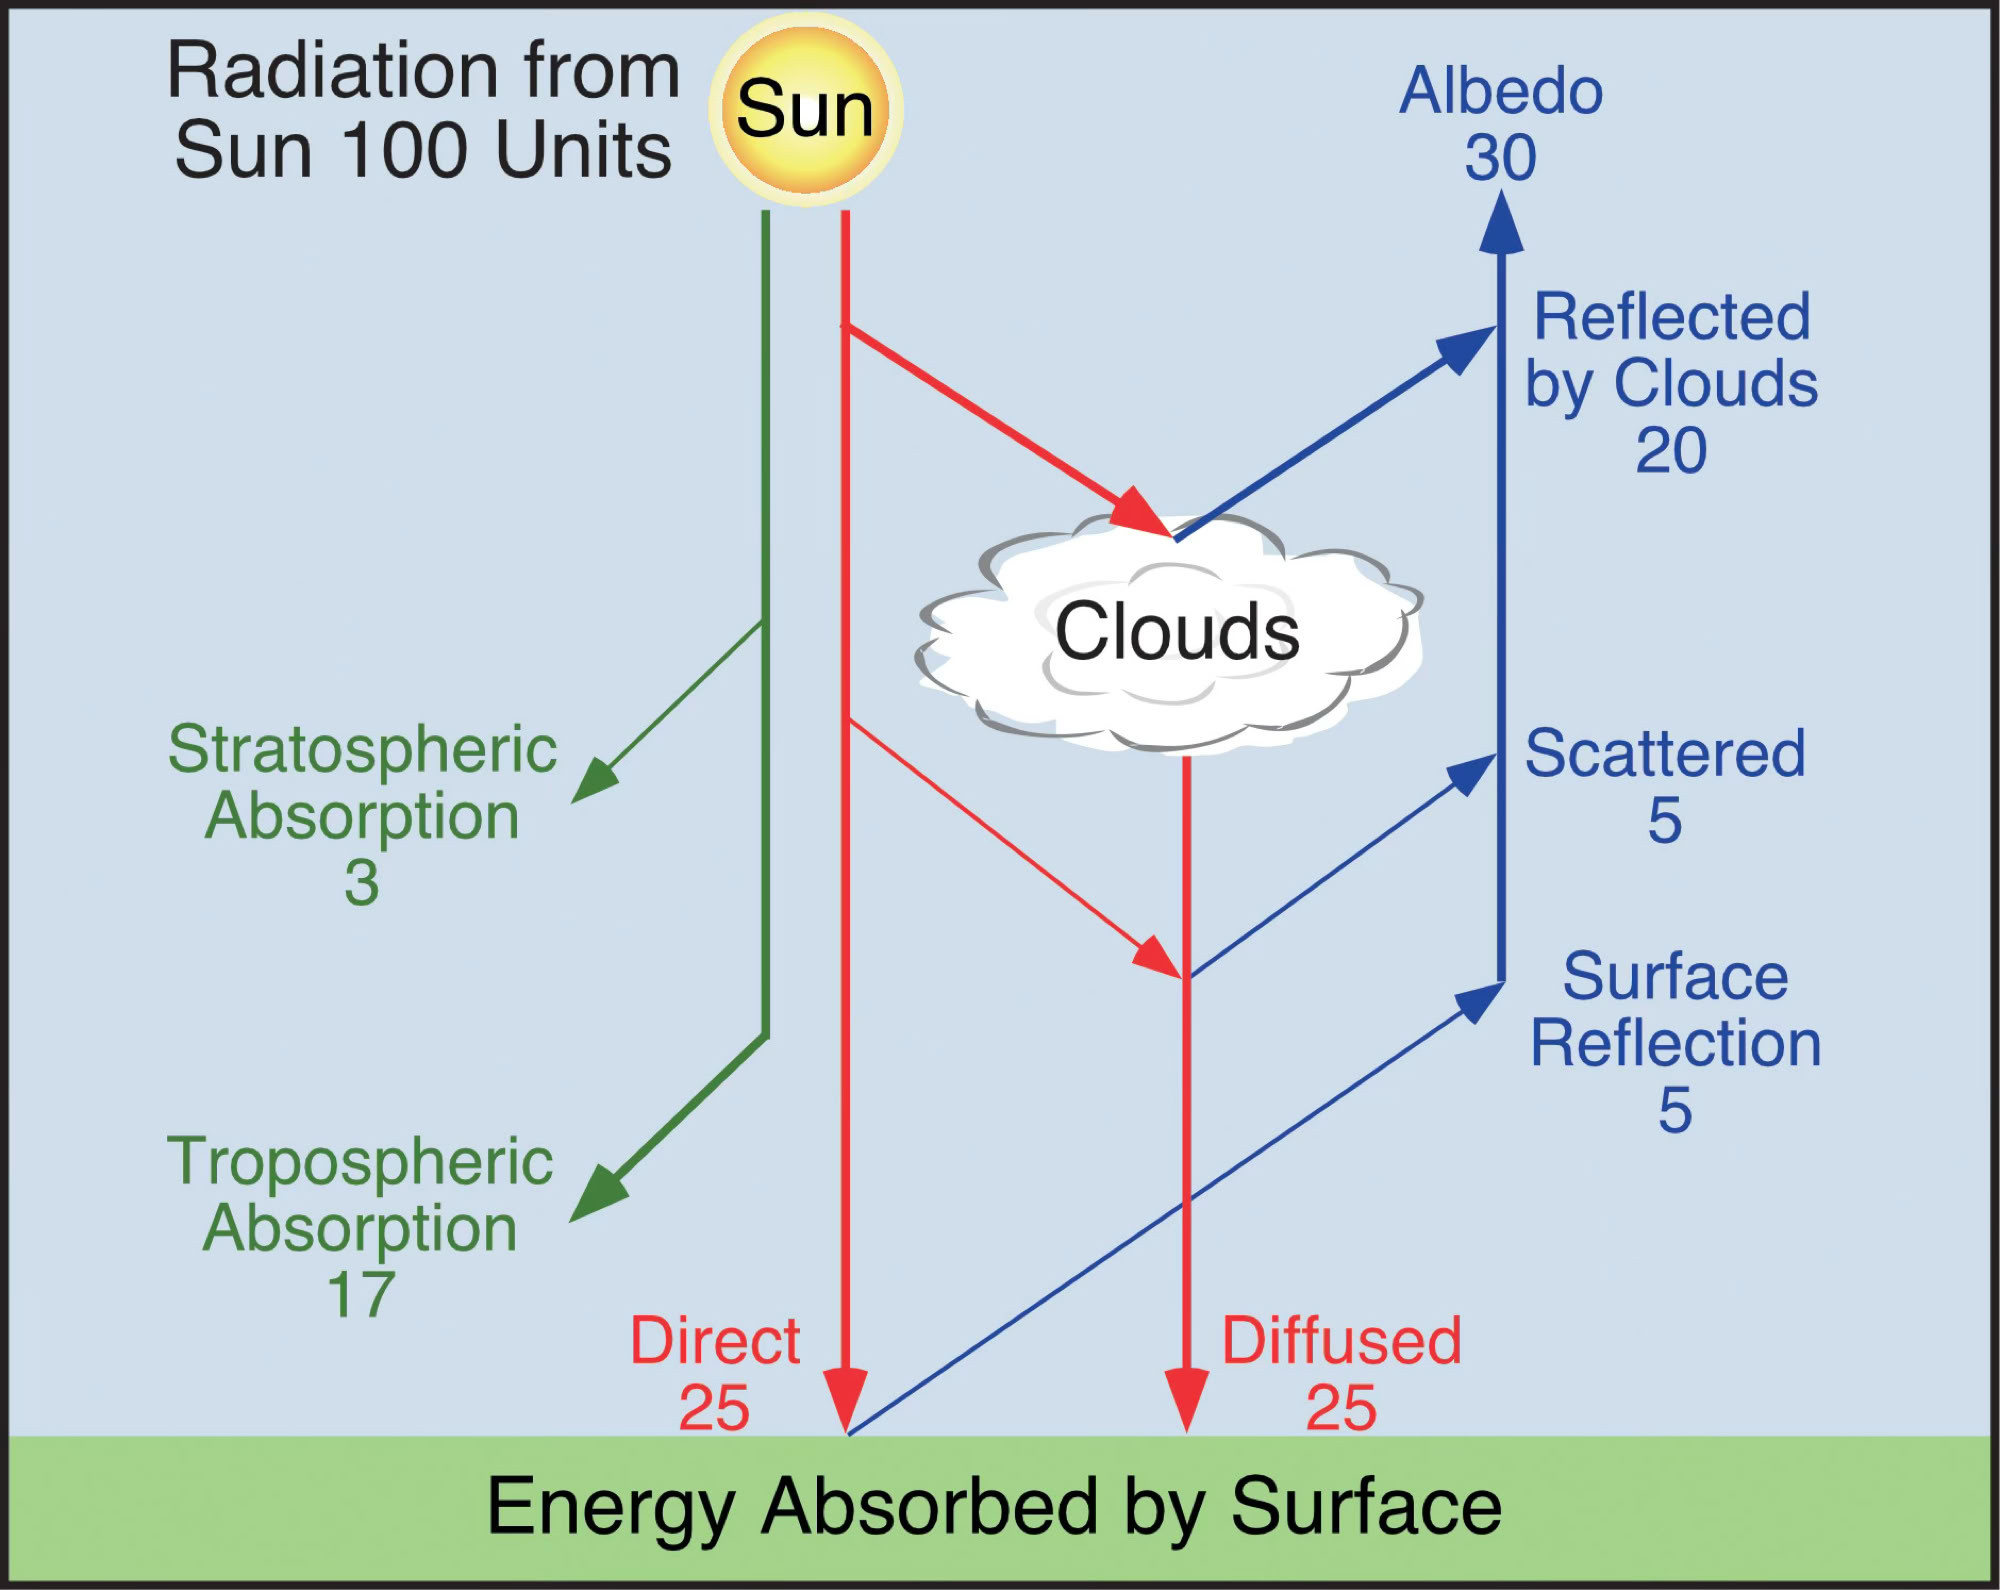
FIGURE 5.30 Global shortwave radiation cascade. For each process in the cascade, the quantities of shortwave radiation used are given as percentages. The shortwave radiation cascade begins with 100 units of insolation available just outside the Earth’s atmosphere. Image Copyright: Michael Pidwirny.
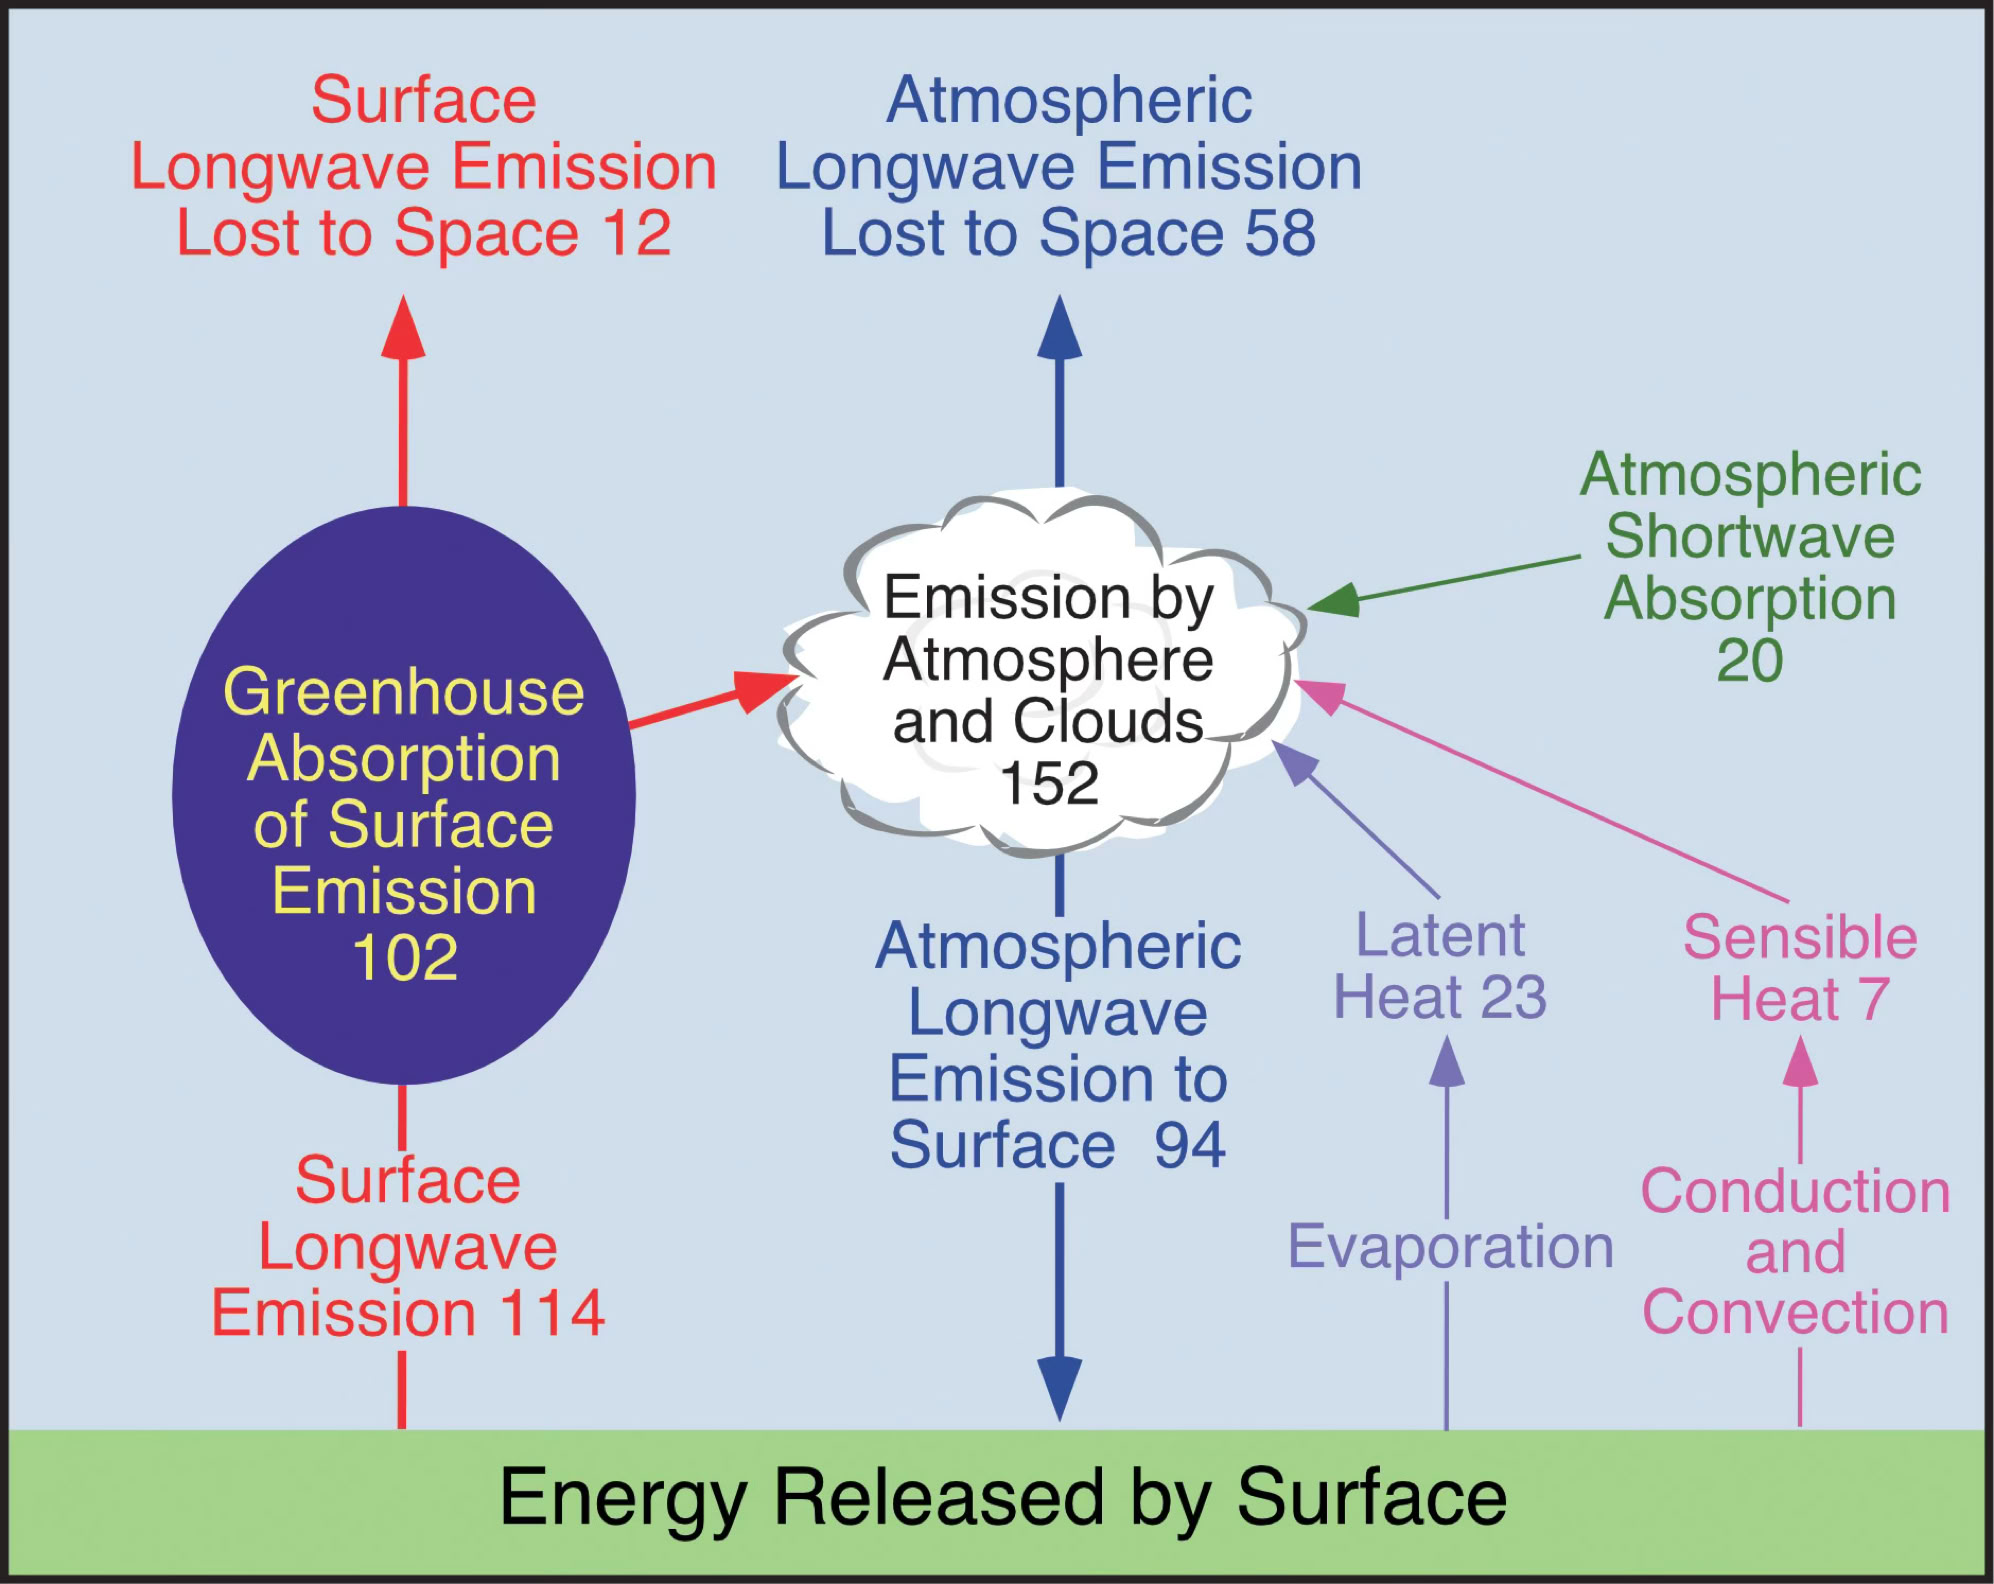
FIGURE 5.31 Global longwave radiation cascade. For each process in the cascade, the quantities of heat energy or longwave radiation used are given as percentages. Image Copyright: Michael Pidwirny.

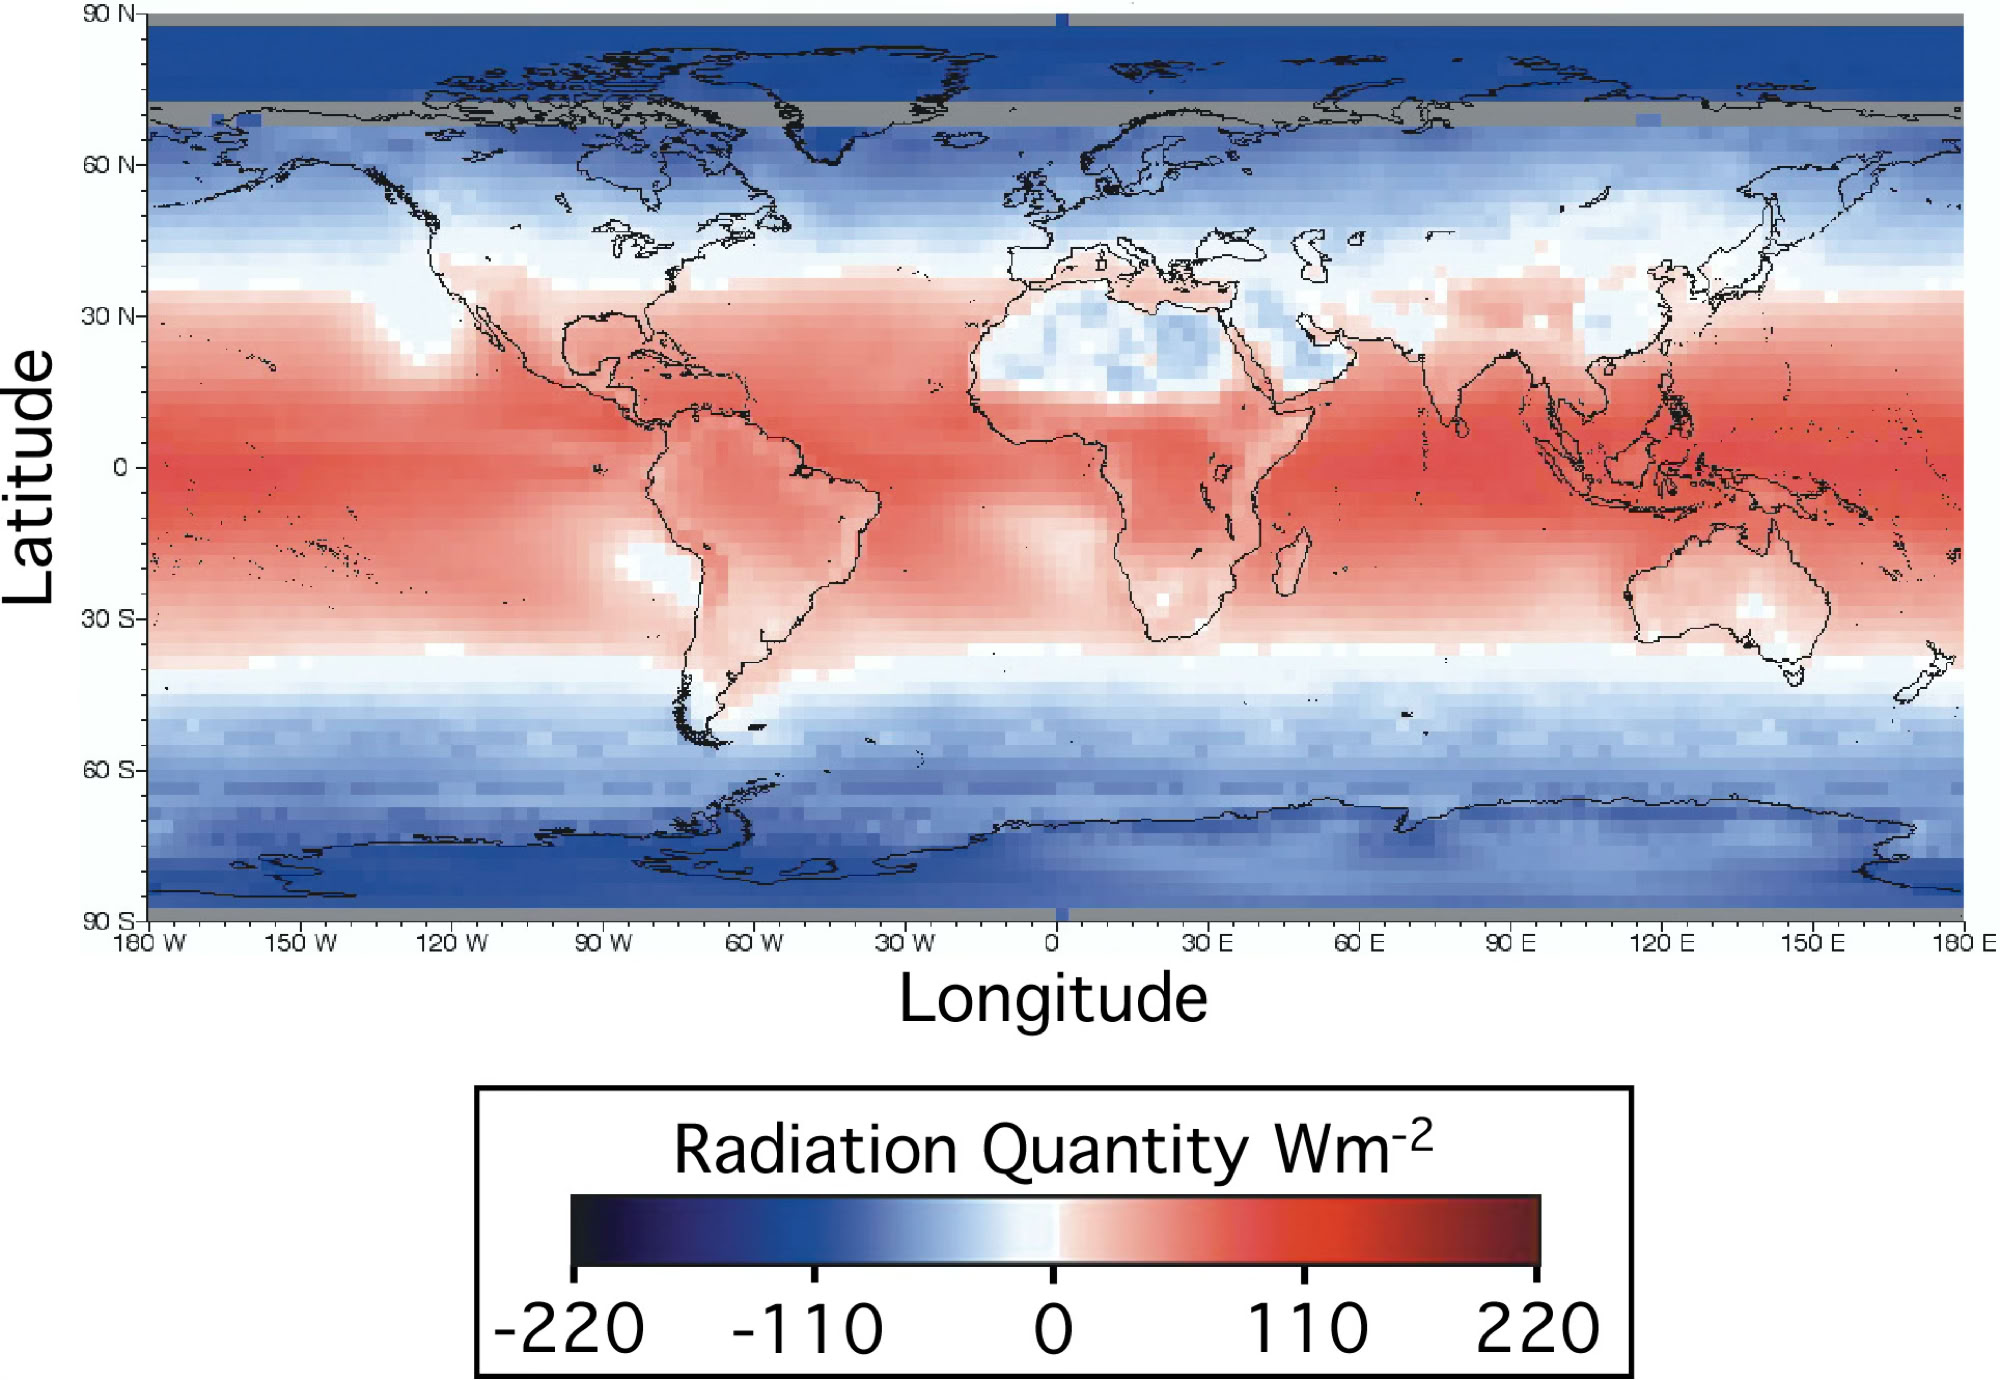
FIGURE 5.32 Annual net radiation of the Earth’s combined surface and atmosphere for 1987 as measured by sensors aboard various satellites for NASA’s Earth Radiation Budget Experiment (ERBE). Cells with missing data are colored grey. Image Source: NASA - Earth Radiation Budget Experiment.
