Daily Cycles
At the Earth's surface, quantities of insolation and net radiation undergo daily cycles of change because the planet rotates on its polar axis once every 24 hours. Variations in net radiation are primarily responsible for the particular patterns of rising and falling surface air temperature over 24 hours. Insolation is usually the main positive component making up net radiation.
Figure 6.15 shows hypothetical average insolation, net radiation, and air temperature curves for a typical land-based location in the Northern Hemisphere at 45° of latitude on the equinoxes and solstices. For all dates, peak reception of insolation occurs at solar noon when the Sun attains its greatest height above the horizon. The net radiation graph shows a surplus during most of the day and a deficit throughout the night. This deficit begins just before sunset, when emitted longwave radiation from the Earth's surface exceeds insolation and the atmosphere's reradiated longwave radiation (greenhouse effect). The relative placement of the temperature profiles for the various dates is associated with the amount of net radiation available for daily surface absorption and heat generation. The more energy is available, the higher up the Y-axis the temperature profile is on the graph. The September equinox (September 21/22) is warmer than the March equinox (March 21/22) because of the heating that occurred in the previous summer months. This heat energy is stored in the atmosphere and the ground.
For all dates, the minimum temperature occurs shortly after sunrise when the location again receives insolation from the Sun, which is turned into heat energy at the Earth's surface. The temperature drops throughout the night because of three processes. First, the surface of the Earth stops heating because solar radiation is no longer being absorbed. Second, conduction and convection transport heat energy into the atmosphere, and the warm air at the surface is replaced by cooler air from above by atmospheric mixing. Third, the Earth's surface radiation balance becomes negative after sunset. This situation indicates that some of the heat energy found in the atmosphere and the ground is being converted into outgoing longwave radiation. This process causes temperatures to drop. The temperature rises when the surface's net radiation budget becomes positive. The temperature continues to rise from sunrise until well after solar noon. After this time, the air near the Earth's surface has gained enough heat to initiate strong convective updrafts. These updrafts move warm air from near the surface to higher altitudes. This process also causes surface air temperatures to drop because the rising warm air is replaced by the downward flow of cooler air from higher altitudes.
Annual Cycles
As the Earth revolves around the Sun, locations on the surface undergo seasonal changes in surface air temperature. Monthly temperature variations generally follow temporal changes in the availability of net radiation. Net radiation represents energy available to do work. When it reaches Earth's surface, much of this energy is converted to sensible heat, which we perceive as the surface air temperature. Variations in net radiation are primarily controlled by changes in the intensity and duration of incoming insolation, which, in turn, are mainly determined by latitude (see Chapter 5, Figures 5.32 and 5.33).
The following discussion examines how changes in the amount of net radiation affect mean monthly temperatures at seven locations with different latitudes (Figure 6.16). Table 6.3 lists these locations and describes the annual net radiation, mean temperature, and annual temperature range. This table also illustrates the effect increasing latitude has on each of these climatic variables.
At Singapore (latitude 1°N), the monthly average net radiation is 132 Wm-2. Monthly variation in net radiation is minimal because there is little seasonal change in insolation input (Figure 6.17). Because of the consistent nature of net radiation, the average mean monthly air temperature only varies annually by 1.5°C (2.7°F). Yearly net radiation receipts are highest in February, March, and April. This time corresponds to a seasonal dry period, with lower cloud cover and higher solar radiation. The highest temperatures occur in May and June (27.5°C or 81.5°F), one month after the annual peak in net radiation. Periods of maximum net radiation are not always synchronized with average mean monthly temperature peaks. Most locations have a time lag of one to two months. The delayed transfer of stored heat energy in the ground by conduction, convection, and longwave radiation emission into the lower atmosphere is responsible for this lag effect. This same process can also postpone the timing of the lowest mean monthly temperature.
Singapore’s monsoon rainy season occurs from November to January. Clouds associated with the monsoons are responsible for a seasonal dip in net radiation and average mean monthly temperature. Net radiation reaches its lowest value in November at the beginning of the rainy season. The rainy season is associated with greater cloud cover, which reduces the amount of insolation absorbed at the ground surface. The lowest average mean monthly temperature (26.0°C or 78.8°F) occurs in January at the end of the monsoon season.
Net radiation at the dry tropical location of Aden Khormaksar (latitude 13°N) exhibits two peaks over the course of a year, as shown in Figure 6.18. The two net radiation maxima occur in April and August. These dates coincide with solar noon, when the Sun is directly overhead and insolation is at its greatest. All locations between the Tropic of Cancer (23.5°N) and the Tropic of Capricorn (23.5°S) have two days when the Sun is directly overhead at solar noon. Consequently, Aden Khormaksar also experiences two peaks in the average mean monthly temperature. The first occurs in June (32.2°C or 90.0°F), two months after the April net radiation maximum. The second peak occurs in September (31.2°C or 88.2°F), only one month after the August maximum secondary net radiation. The coolest month is January, with an average mean temperature of 25.1°C (77.2°F). Again, there is a lag between the timing of the coolest mean monthly temperature and the lowest monthly value of net radiation. The lowest annual value of net radiation occurs in December when the Sun reaches its lowest altitude above the horizon (53.5° at solar noon) and day length is at a minimum (about 11 hours and 22 minutes).
The last of the low latitude locations is Maputo, Mozambique (latitude 26°S). Maputo’s annual net radiation patterns and average mean monthly surface air temperature are the most variable of the three low-latitude locations examined. This variability has also become monotonic: only one high and one low per year for both measures. This pattern will be a common feature in the remaining four locations examined. In Maputo, the maximum net radiation and the highest average mean monthly temperature (25.8°C or 78.4°F) occur together in January (Figure 6.19). The timing of this peak roughly coincides with summer in the Southern Hemisphere, when day lengths are long and solar heights are at a maximum. This situation is the opposite of what occurs in the Northern Hemisphere. The lowest monthly temperatures occur in July (18.4°C or 65.1°F), one month after net radiation reaches its annual low.
Buenos Aires, Argentina (latitude 35°S), and Lethbridge, Canada (latitude 50°N) are typical middle-latitude locations. For both locations, variations in net radiation and monthly temperature are closely synchronized. The highest and lowest monthly temperatures for Buenos Aires occur in December (23.5°C or 74.3°F) and July (10.0°C or 50.0°F), respectively (Figure 6.20). Accordingly, the annual range in surface air temperature is 13.5°C (24.3°F). Lethbridge experiences greater variations in net radiation and monthly temperature (Figure 6.21). This greater variation can be explained by the effect that increasing latitude has on day length and the angle of incidence. At 50°N, day length varies annually from 16 hrs and 18 minutes (June solstice) to 7 hrs and 42 minutes (December solstice), and maximum Sun angles range from 63.5° (June solstice) to 16.5° (December solstice) above the horizon. The highest monthly temperatures in Lethbridge occur in July (18.6°C or 65.5°F), while the lowest temperatures occur in January (-8.4°C or 16.9°F). Thus, Lethbridge’s annual range of monthly temperatures is 27°C (48.6°F), which is twice as great as Buenos Aires's. It is also important to note that four months have negative net radiation values. Most terrestrial locations poleward of 35°N and S experience a period each year when net radiation is negative. The length of this period generally becomes longer as latitude increases. Periods of negative net radiation arise when outgoing longwave radiation exceeds incoming radiation.
The final two locations examined are found in the high latitudes: Whitehorse (latitude 61°N) and Resolute (latitude 75°N). Whitehorse experiences a six-month period when net radiation is negative (Figure 6.22). The highest and lowest monthly temperatures in Whitehorse are 14.0°C (57.2°F) in July and -18.4°C (-1.1°F) in January, respectively, and the annual range in temperature is 32.4°C (58.3°F). Resolute experiences an additional month of negative net radiation because of its higher latitude, and only two months have average temperatures above freezing (Figure 6.23). This location’s coldest month is February, with a temperature of -33.3°C (-27.9°F). As in the other locations examined, the warmest month is July, with a temperature of only 4.2°C (39.6°F). The annual temperature range is an extreme 37.5°C (67.5°F)!

FIGURE 6.15 Hypothetical hourly variations in insolation, net radiation, and surface air temperature for a location at 45° North latitude for the two equinoxes, June solstice, and December solstice. Image Copyright: Michael Pidwirny.

FIGURE 6.16 Locations for net radiation/temperature comparisons. Image Copyright: Michael Pidwirny.
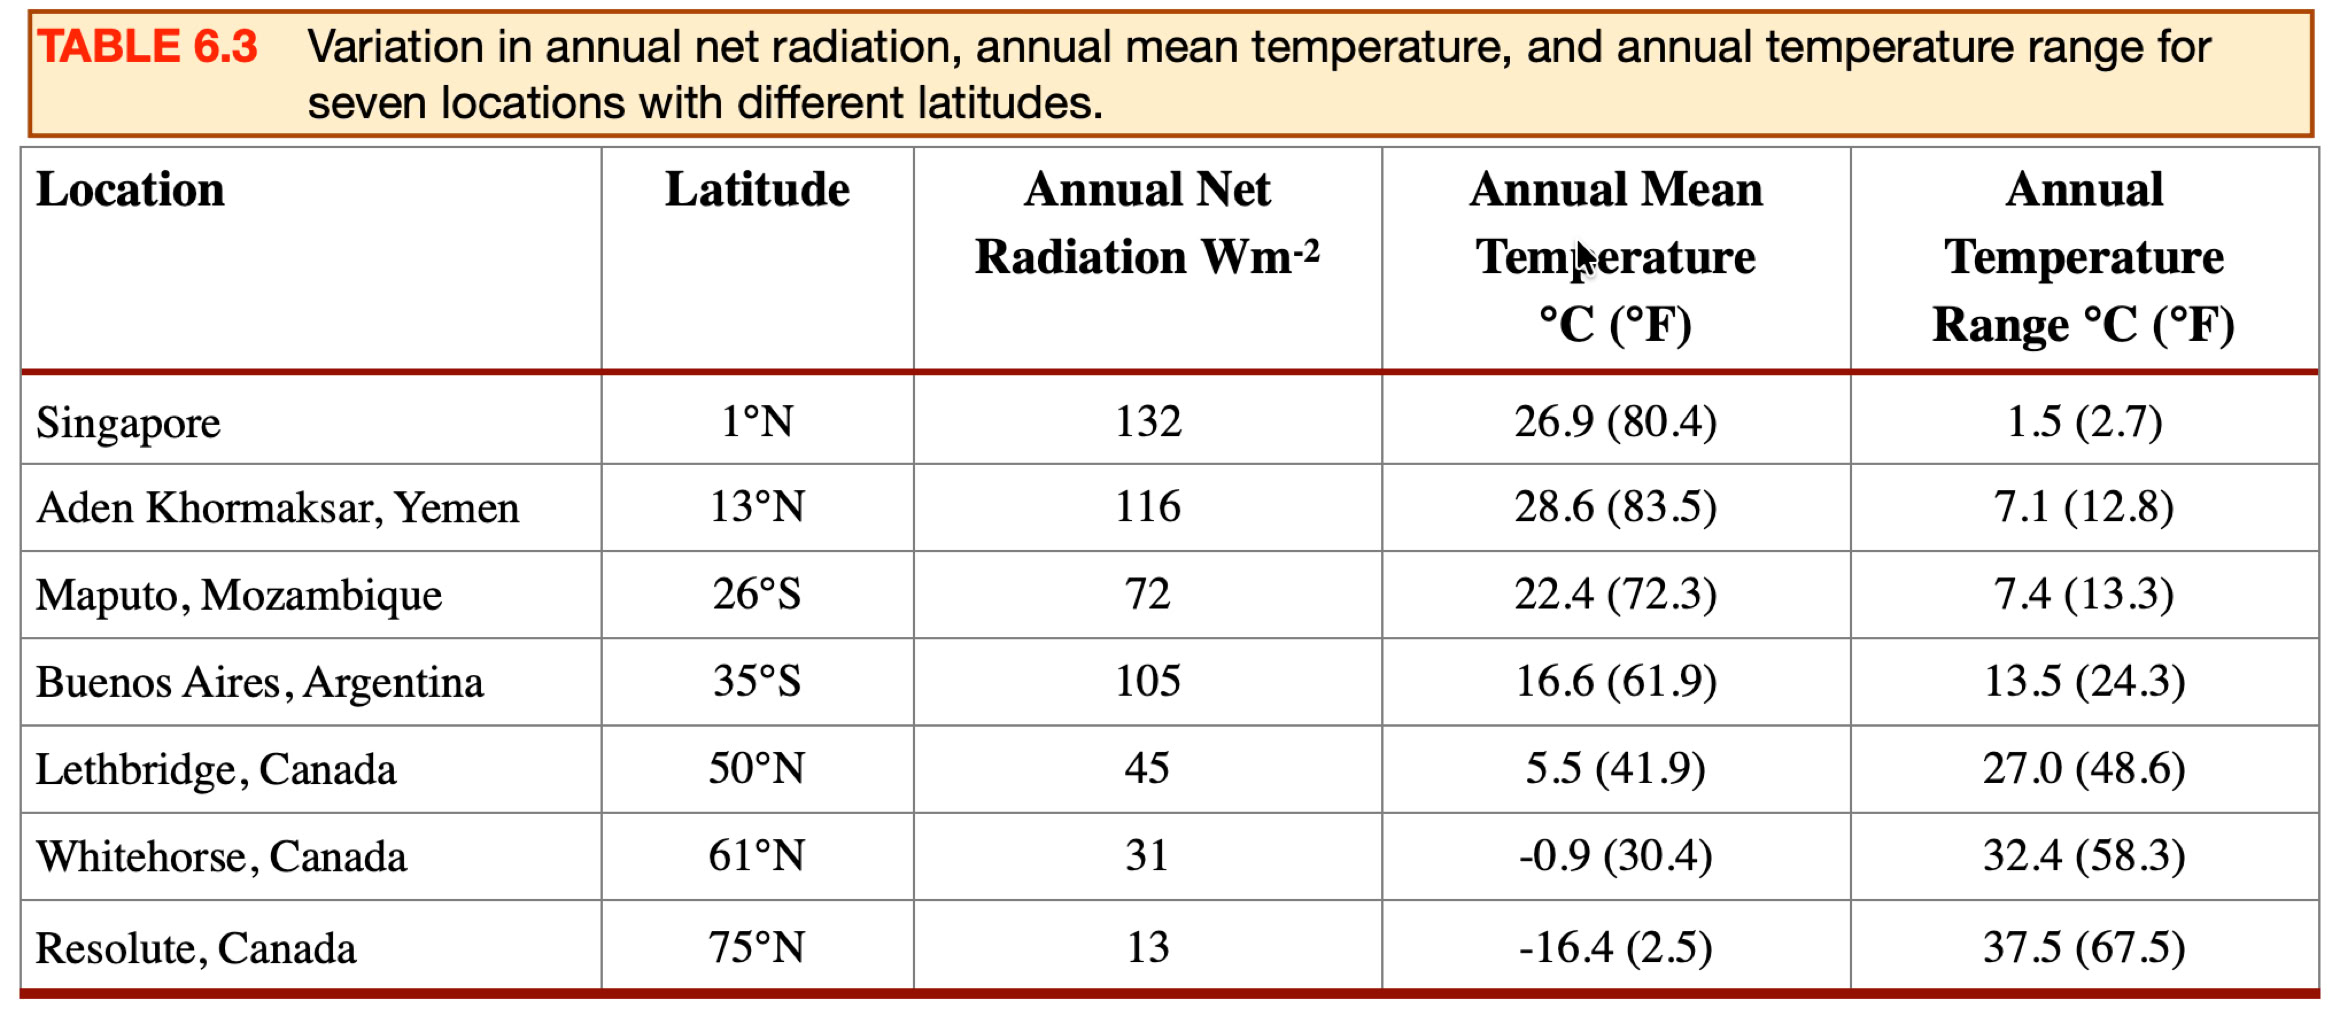

FIGURE 6.17 Relationship between mean monthly net radiation and surface air temperature for Singapore. Averages of mean monthly surface air temperatures were calculated for the period 1877 to 1988. Average mean monthly net radiation data from the Global Energy Balance Archive (GEBA). Image Copyright: Michael Pidwirny.

FIGURE 6.18 Relationship between mean monthly net radiation and surface air temperature for Aden Khormaksar, Yemen. Averages of mean monthly surface air temperatures were calculated for the period 1881 to 1990. Average mean monthly net radiation data from the Global Energy Balance Archive (GEBA). Image Copyright: Michael Pidwirny.

FIGURE 6.19 Relationship between mean monthly net radiation and surface air temperature for Maputo, Mozambique. Averages of mean monthly surface air temperatures were calculated for the period 1892 to 1990. Average mean monthly net radiation data from the Global Energy Balance Archive (GEBA). Image Copyright: Michael Pidwirny.

FIGURE 6.20 Relationship between mean monthly net radiation and surface air temperature for Buenos Aires, Argentina. Averages of mean monthly surface air temperatures were calculated for the period 1856 to 1989. Average mean monthly net radiation data from the Global Energy Balance Archive (GEBA). Image Copyright: Michael Pidwirny.

FIGURE 6.21 Relationship between mean monthly net radiation and surface air temperature for Lethbridge, Canada. Averages of mean monthly surface air temperatures were calculated for the period 1936 to 1990. Average mean monthly net radiation data from the Global Energy Balance Archive (GEBA). Image Copyright: Michael Pidwirny.

FIGURE 6.22 Relationship between mean monthly net radiation and surface air temperature for Whitehorse, Canada. Averages of mean monthly surface air temperatures were calculated for the period 1942 to 1990. Average mean monthly net radiation data from the Global Energy Balance Archive (GEBA). Image Copyright: Michael Pidwirny.
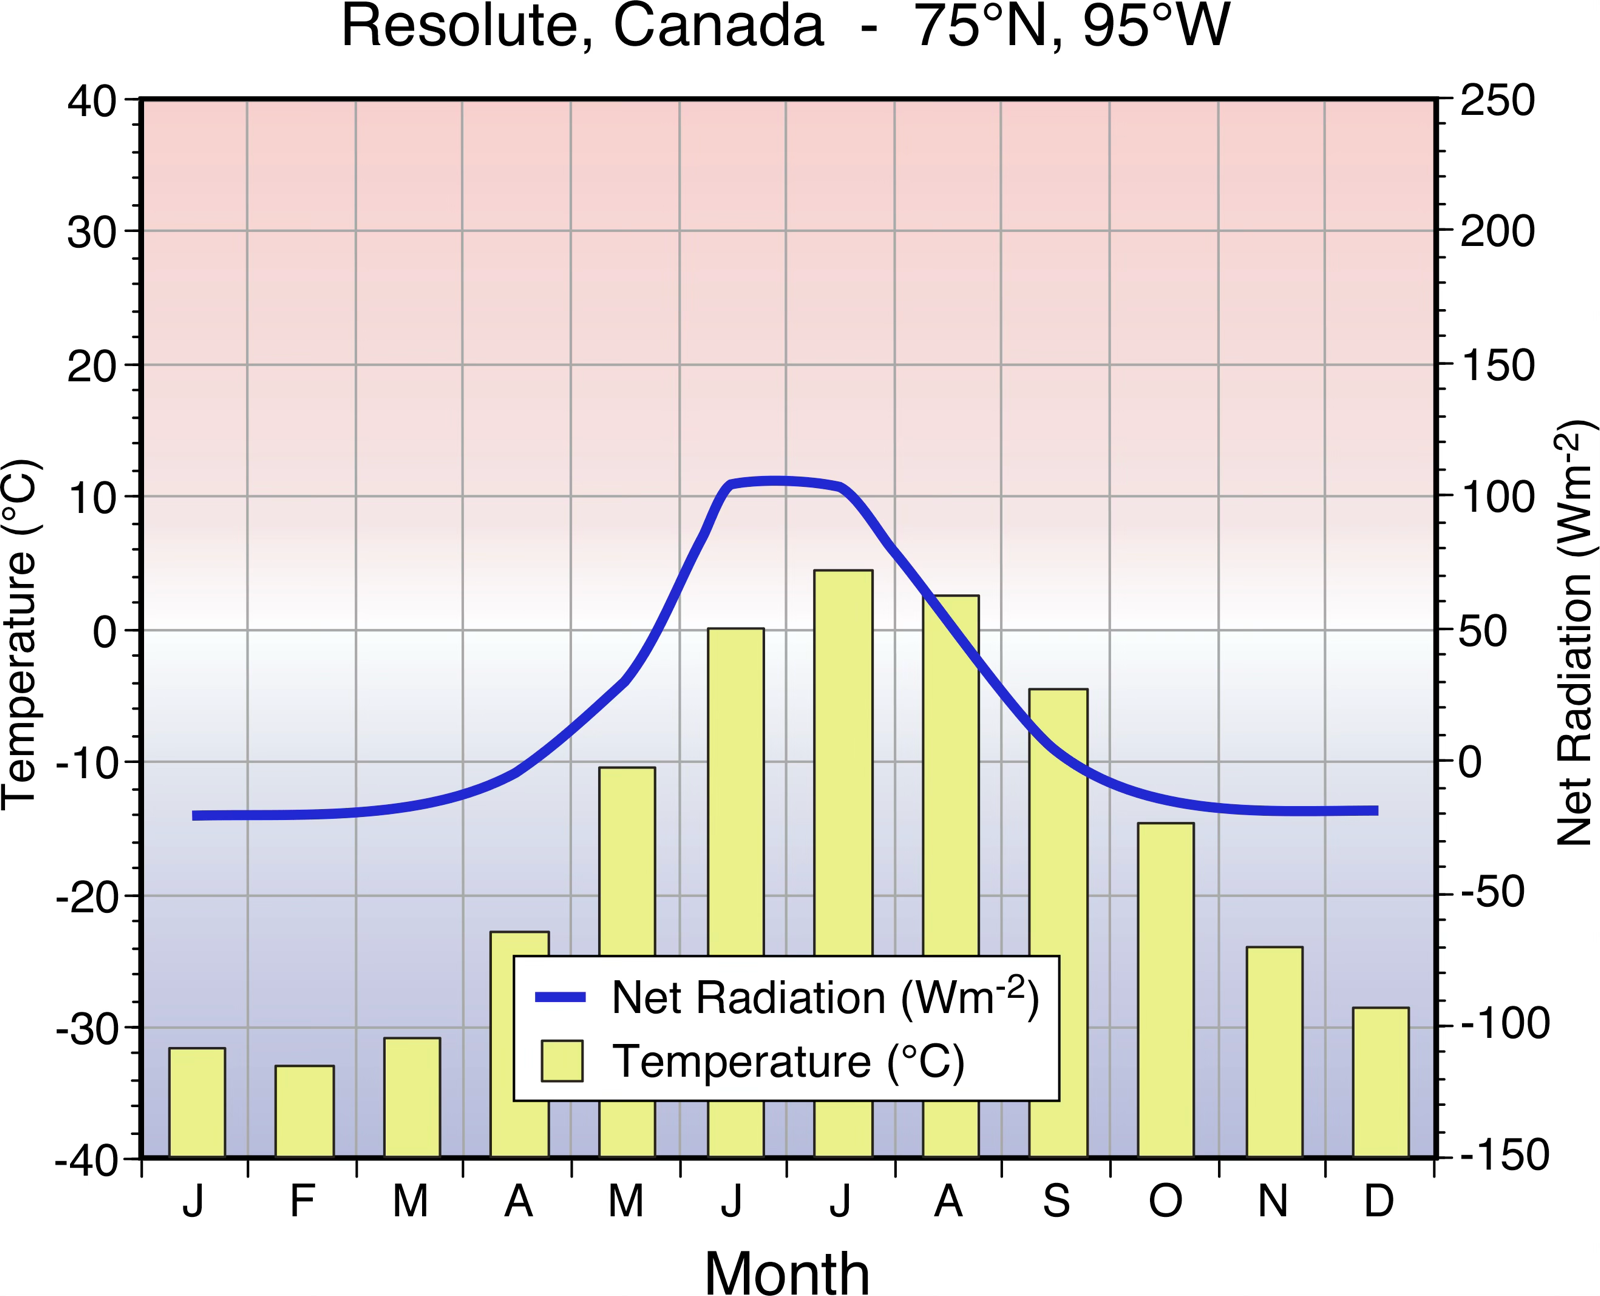
FIGURE 6.23 Relationship between mean monthly net radiation and surface air temperature for Resolute, Canada. Averages of mean monthly surface air temperatures were calculated for the period 1948 to 1990. Average mean monthly net radiation data from the Global Energy Balance Archive (GEBA). Image Copyright: Michael Pidwirny.